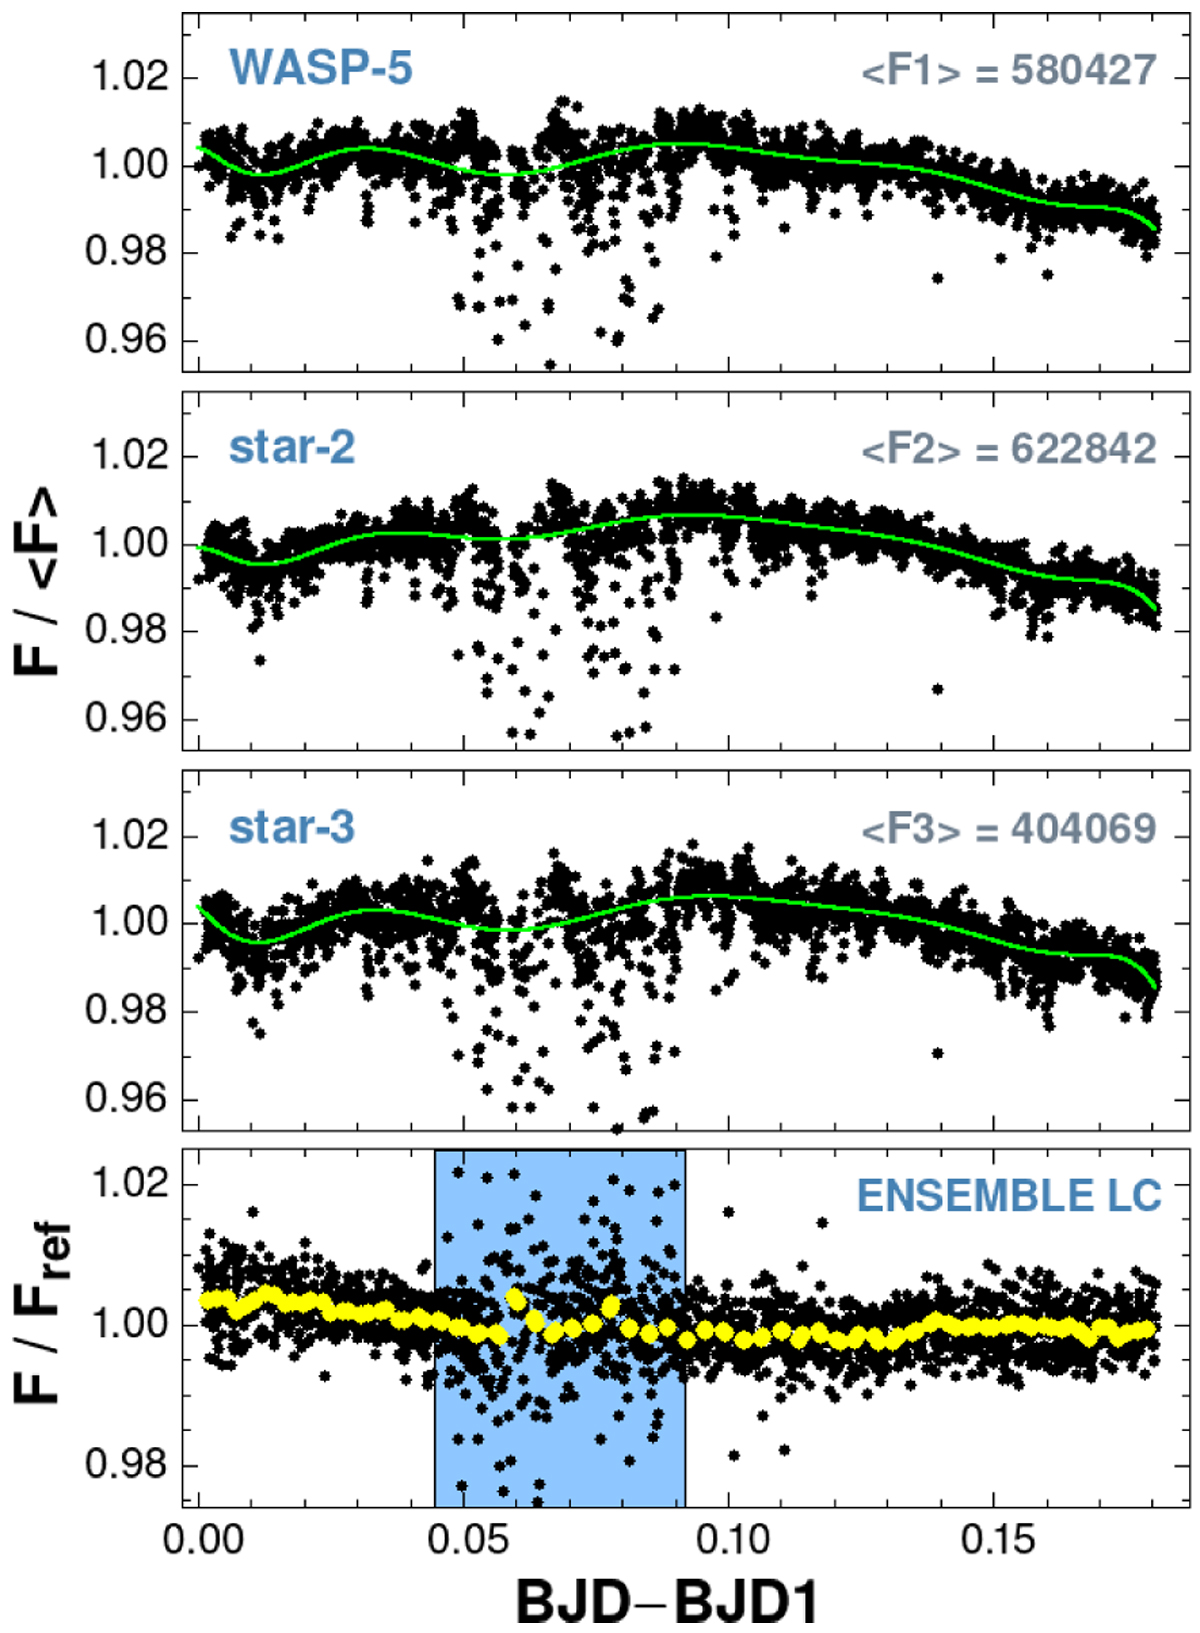
Fig. 2
Download original image
Raw flux variations for set-2 (see Table 1) and the resulting ensemble light curve (target flux over reference flux, ~ F1 /(F2 + F3), without outlier correction, normalized to its average). Stars 2 and 3 (see Fig. 1) serve as comparison stars. The eleventh-order polynomials, robustly fitted to the fluxes to handle outliers, are shown by green lines. The shaded area in the bottom panel indicates the period of intermittent clouds. The binned light curve (with overlapping bins – see text) is shown by yellow dots. The time axis is shifted to the moment of the first data point (BJD1).
Current usage metrics show cumulative count of Article Views (full-text article views including HTML views, PDF and ePub downloads, according to the available data) and Abstracts Views on Vision4Press platform.
Data correspond to usage on the plateform after 2015. The current usage metrics is available 48-96 hours after online publication and is updated daily on week days.
Initial download of the metrics may take a while.