Fig. B.4
Download original image
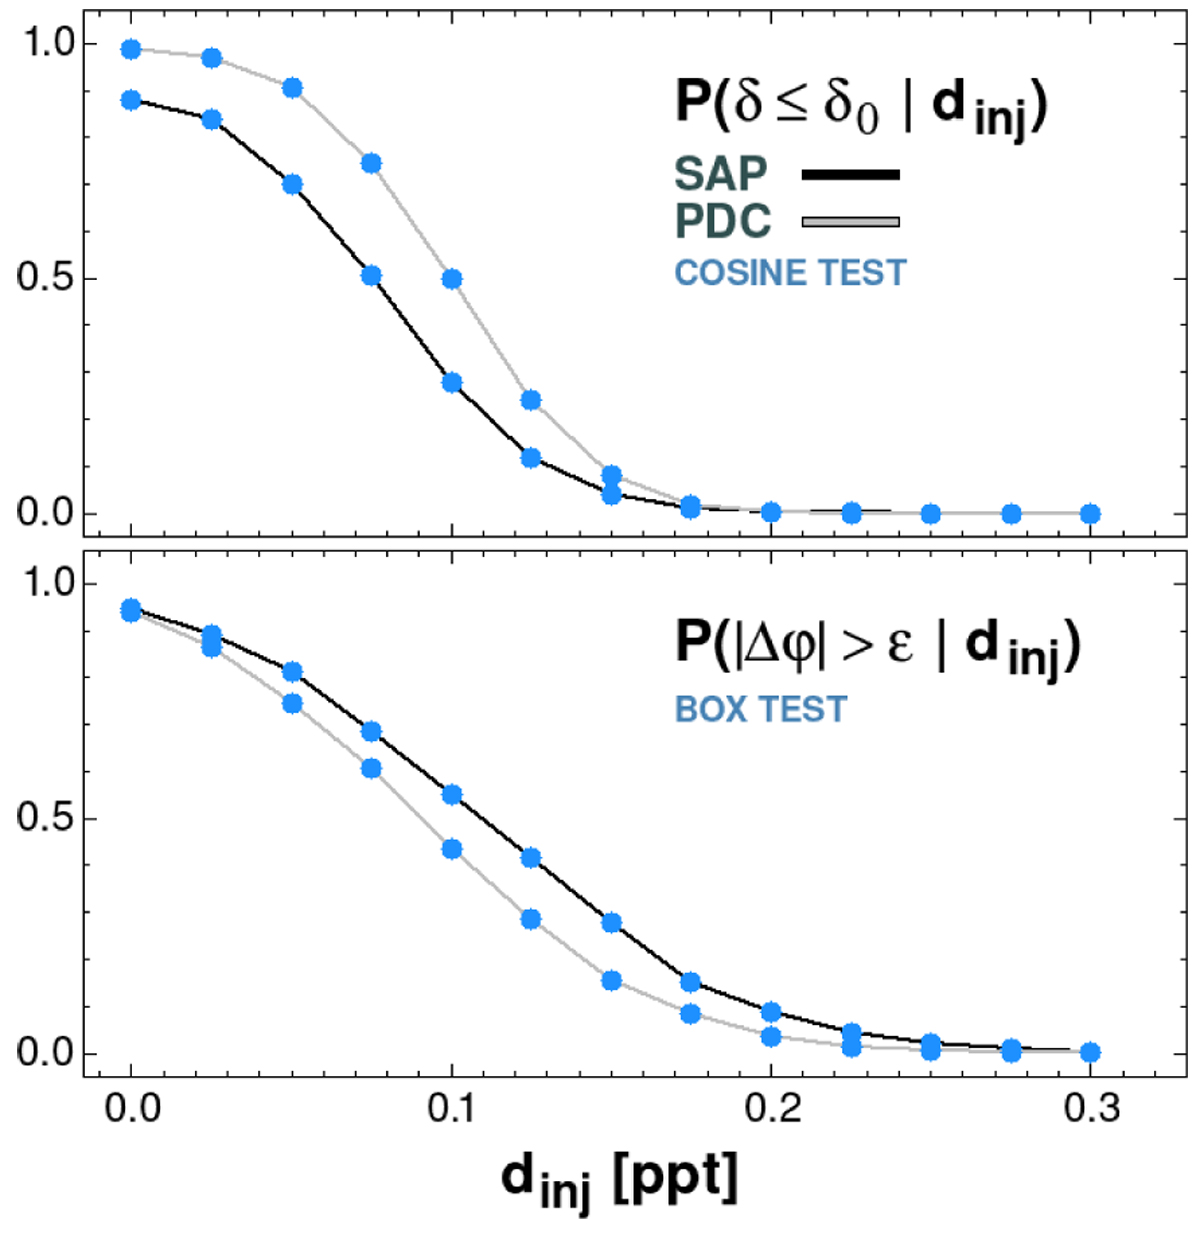
Upper panel: Occurrence rate of the detection of cosine amplitudes δ/2 less than δ0/2 in the presence of injected cosine amplitudes dinj/2. The Gaussian components of the mock signals were generated using the standard deviations of the SAP and PDC time series (first and last rows in Table B.1). The δ0 values refer to the respective total amplitudes in the same table (i.e., 0.086,0.106 ppt for the SAP and PDC data, respectively). Lower panel: Occurrence rate of phase difference Δφ for the same noise models as above but injected by box signals of depths dinj and widths of 2ϵ = 0.060.
Current usage metrics show cumulative count of Article Views (full-text article views including HTML views, PDF and ePub downloads, according to the available data) and Abstracts Views on Vision4Press platform.
Data correspond to usage on the plateform after 2015. The current usage metrics is available 48-96 hours after online publication and is updated daily on week days.
Initial download of the metrics may take a while.