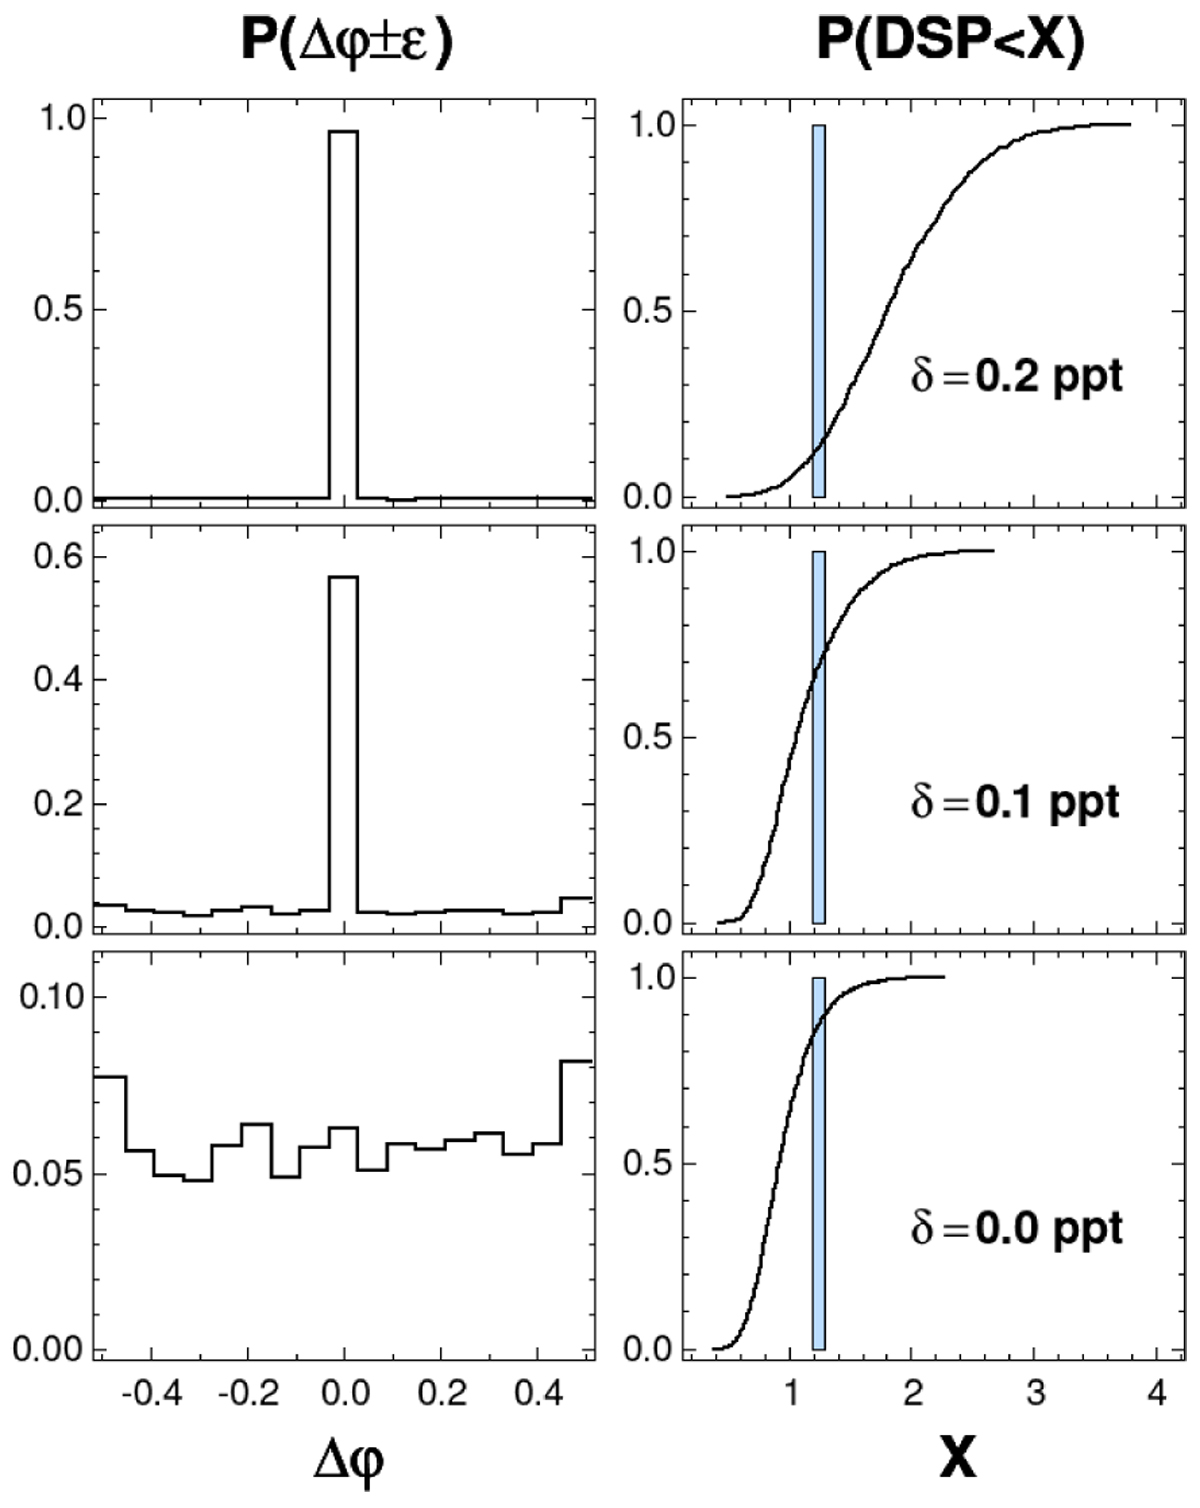
Fig. B.2
Download original image
Injected box test of pure Gaussian noise with σ = 2.32 ppt and n = 33256 data points. Right column: CDF of DSP for various injected box depths δ. Vertical bars show the observed value (6th column of Table B.1 in row 4). Left column: PDF of the phase difference between the test box center and the calculated secondary eclipse center from the bin model for the same box depths as shown in the corresponding panel on the right. The bin width is the total transit duration, i.e., in phase units ϵ = 0.030.
Current usage metrics show cumulative count of Article Views (full-text article views including HTML views, PDF and ePub downloads, according to the available data) and Abstracts Views on Vision4Press platform.
Data correspond to usage on the plateform after 2015. The current usage metrics is available 48-96 hours after online publication and is updated daily on week days.
Initial download of the metrics may take a while.