Fig. 11
Download original image
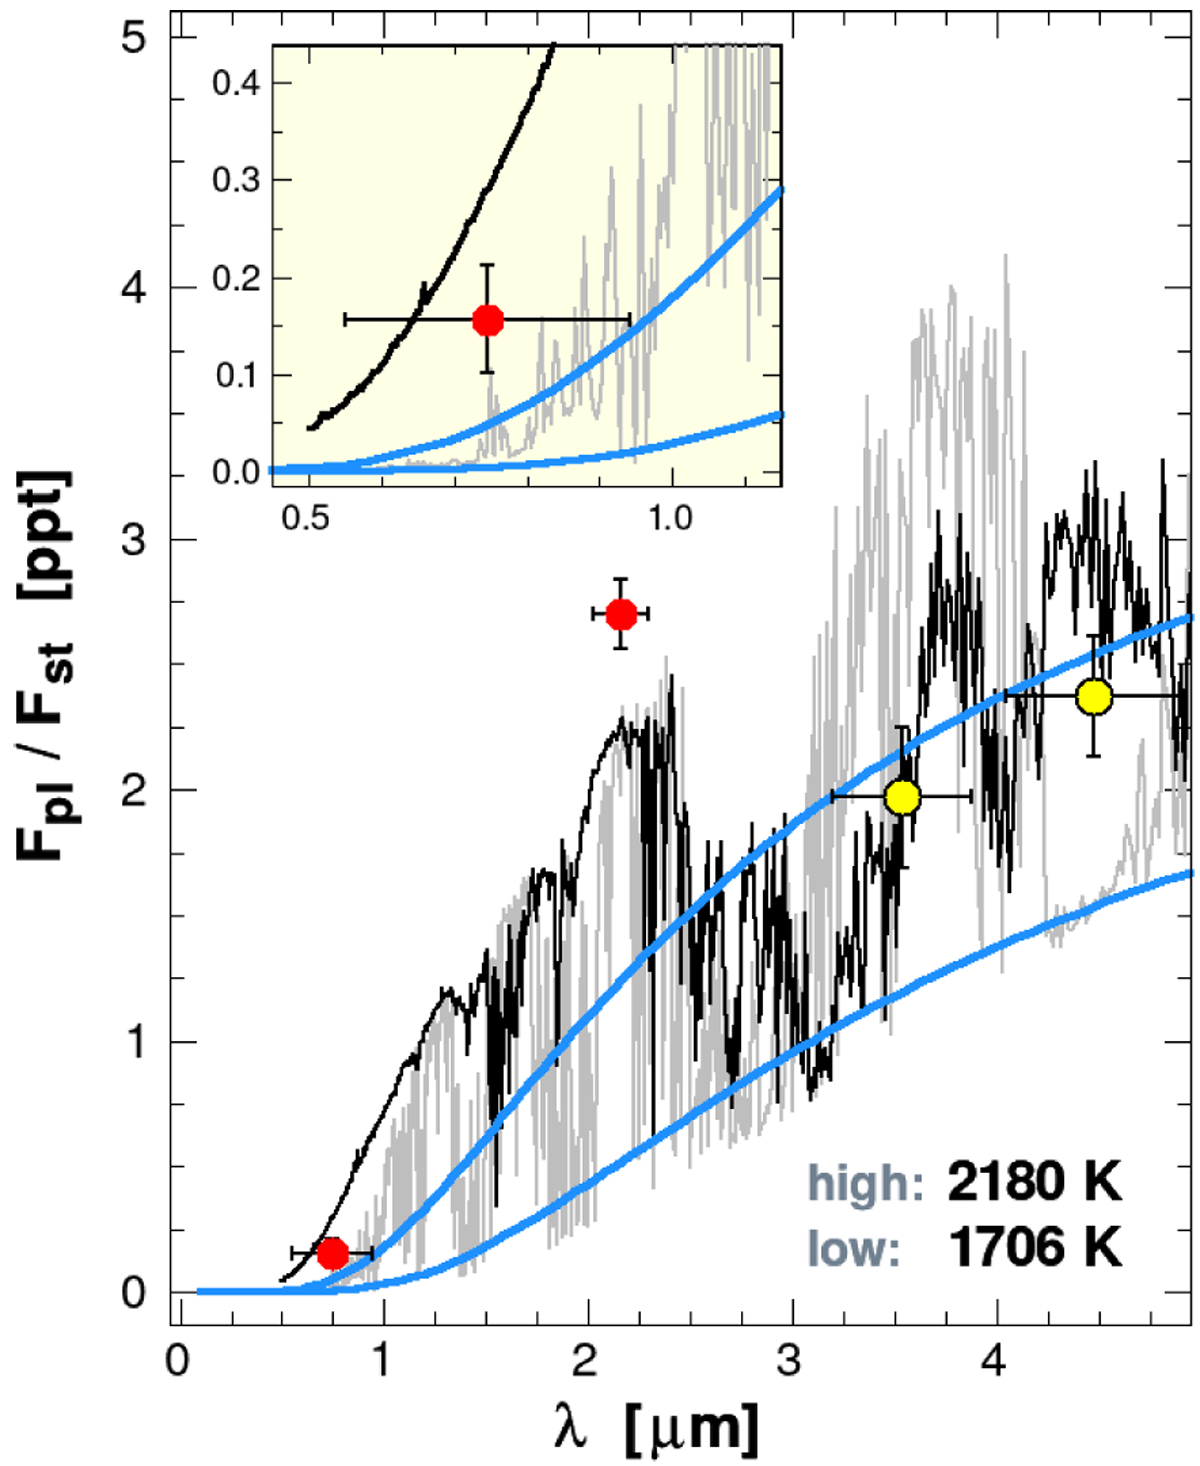
Model thermal emission spectra from Chen et al. (2014) (gray for oxygen- and black for carbon-enhanced chemical compositions). Black body lines for fully efficient (α = 0.25) and inefficient (α = 2/3) circulations are shown by blue lines. The corresponding temperatures are given in the lower right corner. The optical and infrared occultation depths derived in this paper are shown with red dots, and the Spitzer data of Baskin et al. (2013) with yellow dots. The inset zooms in the optical waveband.
Current usage metrics show cumulative count of Article Views (full-text article views including HTML views, PDF and ePub downloads, according to the available data) and Abstracts Views on Vision4Press platform.
Data correspond to usage on the plateform after 2015. The current usage metrics is available 48-96 hours after online publication and is updated daily on week days.
Initial download of the metrics may take a while.