Fig. 1

Download original image
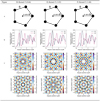
Telescope configurations (sub-figures a), modulation efficiency curves as a function of radial position for each kernel (sub-figures b), and kernel maps (sub-figures c) for each of the simulated architectures (X-array (A), Kernel-3 (B), Kernel-4 (C), and three different scalings of the Kernel-5 (D-F)). The dashed line on the modulation efficiency plots, and the circle on the kernel maps, correspond to the angular separation that the array is optimised for, and defines the value of ΓB. In general, this corresponds to the angular separation with the highest modulation efficiency at the reference wavelength. Angular position in these plots is given in units of λB/B, and the transmission is given in units of single telescope flux.
Current usage metrics show cumulative count of Article Views (full-text article views including HTML views, PDF and ePub downloads, according to the available data) and Abstracts Views on Vision4Press platform.
Data correspond to usage on the plateform after 2015. The current usage metrics is available 48-96 hours after online publication and is updated daily on week days.
Initial download of the metrics may take a while.


