Fig. 3
Download original image
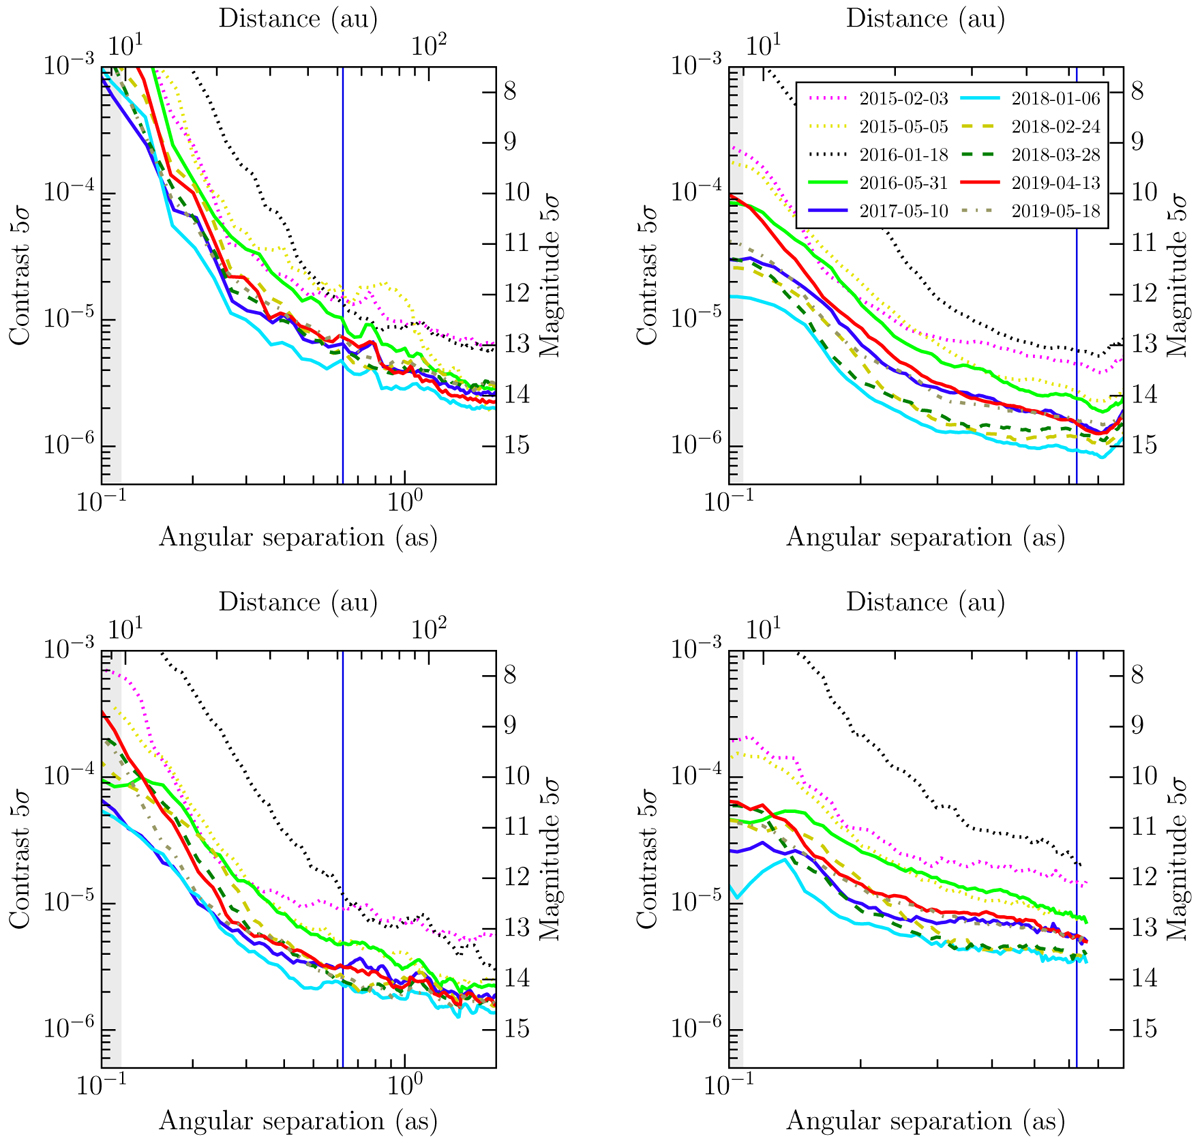
Detection limits at 5σ for IRDIS in the K1 band on the left and IFS in the YJH bands on the right. Data are reduced at the top by the pipeline SpeCal-TLOCI (for IRDIS) or SpeCal-PCAPad (for IFS) and at the bottom by the pipeline ANDROMEDA. The gray area corresponds to the area hidden by the larger coronagraph used for all the epochs (i.e., N_ALC_Ks) which has an inner working angle of 0.107″ and 0.116″ for IFS and IRDIS, respectively. The blue vertical line corresponds to the position of the planet HD 95086 b at the best epoch January 2018 (cyan, 0.625″).
Current usage metrics show cumulative count of Article Views (full-text article views including HTML views, PDF and ePub downloads, according to the available data) and Abstracts Views on Vision4Press platform.
Data correspond to usage on the plateform after 2015. The current usage metrics is available 48-96 hours after online publication and is updated daily on week days.
Initial download of the metrics may take a while.