Fig. 2
Download original image
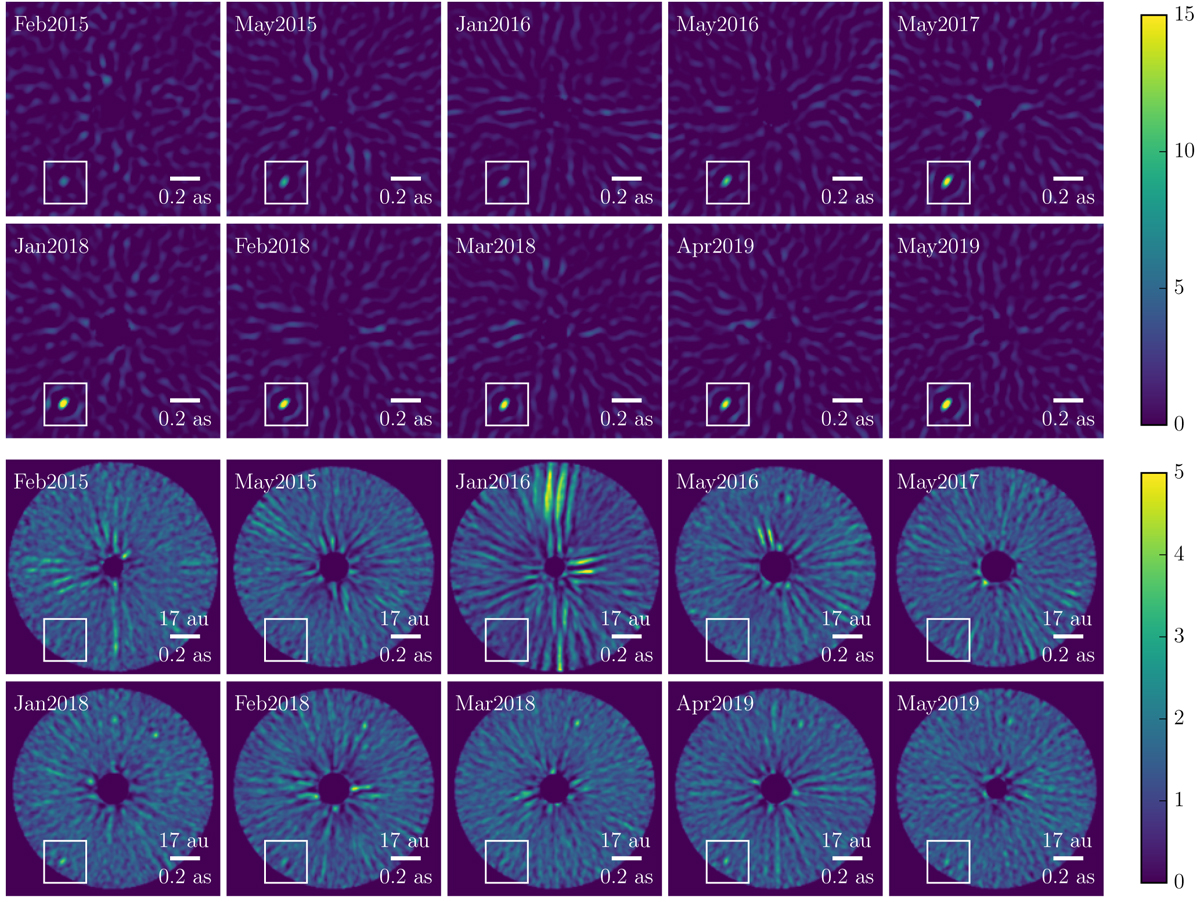
Signal-to-noise ratio maps for all the SPHERE epochs. At the top, SPHERE-IRDIS in the K1 band and at the bottom, SPHERE-IFS in the YJH bands, both reduced by the pipeline ANDROMEDA. The color bar corresponds to the signal-to-noise ratio, 0–15 for IRDIS and 0–5 for the IFS. Planet b is located in the white square. The region below the inner working angle of the coronagraph is masked. In the top right corner of the IFS data, the one (or two) point-like feature(s) correspond to the remanent of the star on the IFS detector.
Current usage metrics show cumulative count of Article Views (full-text article views including HTML views, PDF and ePub downloads, according to the available data) and Abstracts Views on Vision4Press platform.
Data correspond to usage on the plateform after 2015. The current usage metrics is available 48-96 hours after online publication and is updated daily on week days.
Initial download of the metrics may take a while.