Fig. 5
Download original image
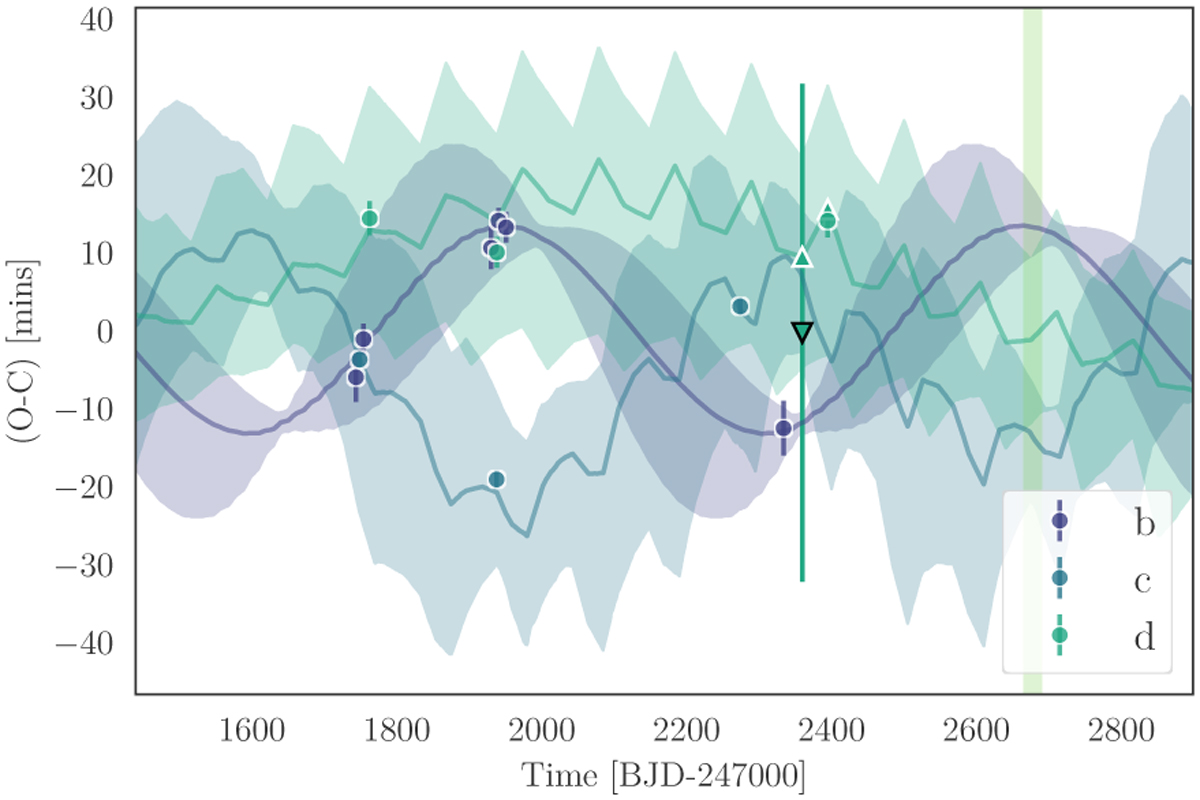
Observed TTVs and TTVFaster/Ultranest TTV models for each of the three planets. Coloured lines show the median best-fit TTV models, while coloured regions show 1 -σ range. The predicted transit time for the low S/N SAINT-EX observation of planet d is shown as a triangle with white edges, while the observed transit time is shown with dark-edged inverted triangles. Planned TESS observations of the two planets in 2022 are shown in light green.
Current usage metrics show cumulative count of Article Views (full-text article views including HTML views, PDF and ePub downloads, according to the available data) and Abstracts Views on Vision4Press platform.
Data correspond to usage on the plateform after 2015. The current usage metrics is available 48-96 hours after online publication and is updated daily on week days.
Initial download of the metrics may take a while.