Fig. 4
Download original image
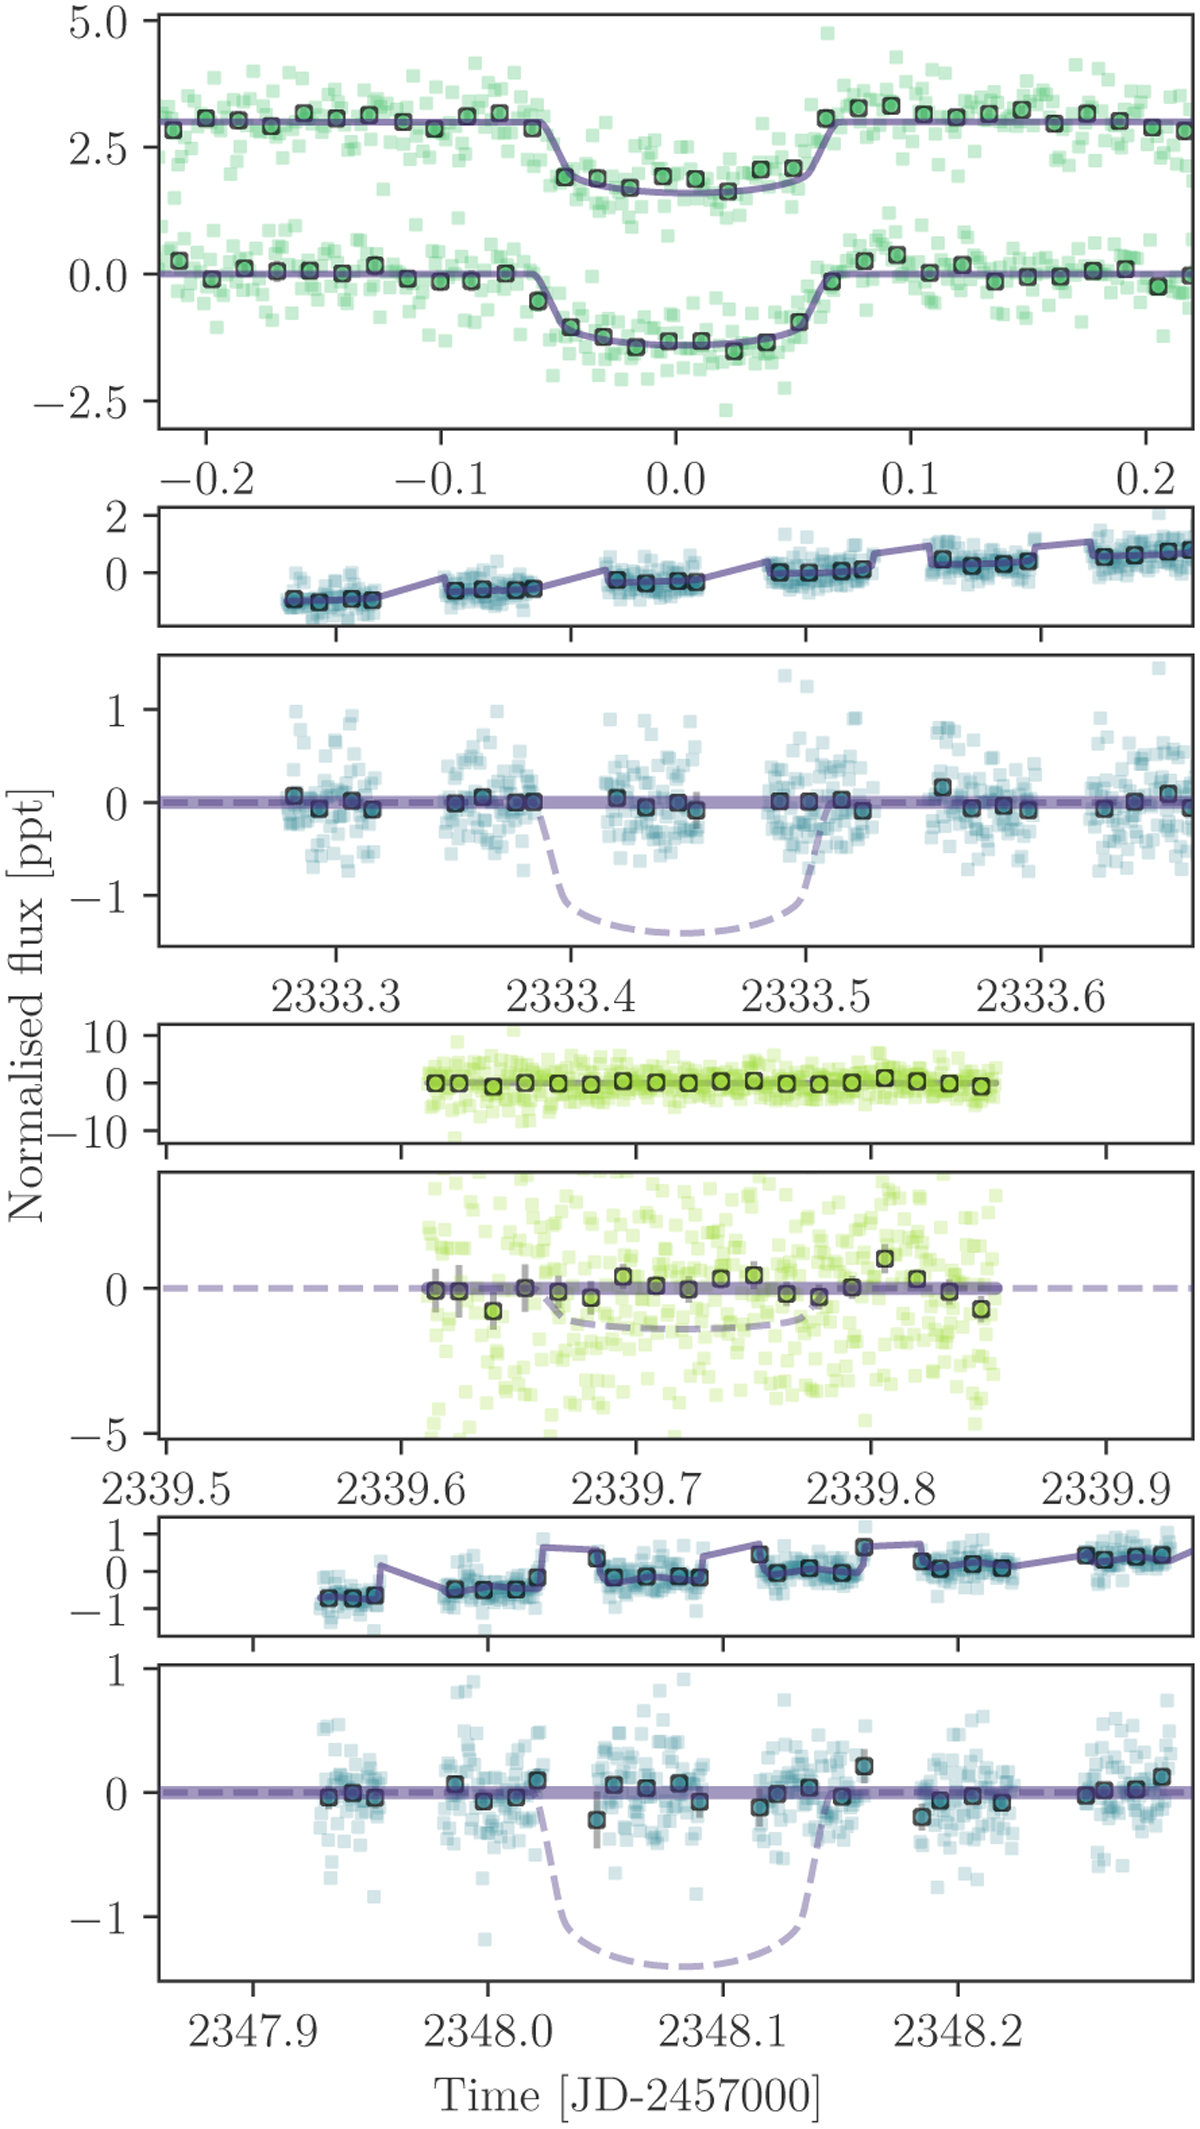
Observations of TOI-2076 d, including unsuccessful transit observations. Upper panel: The two TESS transits detected by H21 as well as our best-fit model from the combined model. Two mid-upper panels: A CHEOPS observation covering the 43.9 d alias. Two mid-lower panels: A LCO/McDonald lm Sinistra lightcurve of the 25.09 d alias. Lower panel: A CHEOPS observation covering both 29.27 d and 58.54 d aliases. In the lower three panels, a TOI-2076 d model-fit is shown to demonstrate the expected transit shape and depth. In the lower three plots, the upper points and line show the raw flux and best-fit decorrelation model, while the lower panel shows the detrended flux and the expected transit model.
Current usage metrics show cumulative count of Article Views (full-text article views including HTML views, PDF and ePub downloads, according to the available data) and Abstracts Views on Vision4Press platform.
Data correspond to usage on the plateform after 2015. The current usage metrics is available 48-96 hours after online publication and is updated daily on week days.
Initial download of the metrics may take a while.