Open Access
Fig. 7.
Download original image
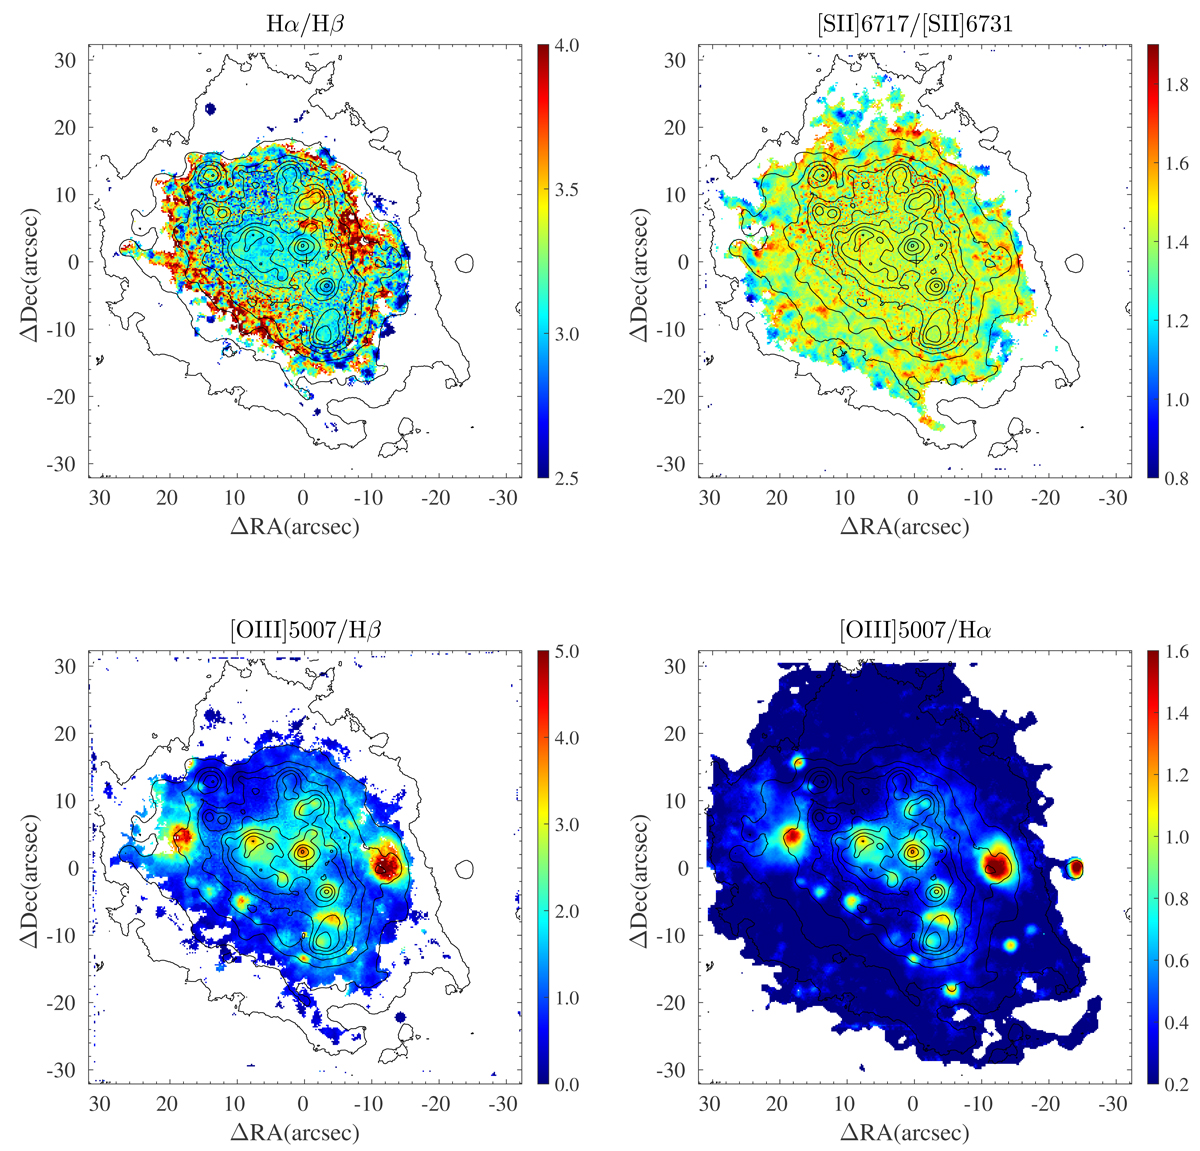
Emission line ratio maps of Haro 14. Top left: balmer decrement, Hα/Hβ. Top right: ratio of the collisional excited sulfur lines, [S II] λλ6717, 6731. Bottom left: excitation map, [O III] λ5007/Hβ. Bottom right: excitation map, [O III] λ5007/Hα. The contour levels of the Hα flux map are overplotted.
Current usage metrics show cumulative count of Article Views (full-text article views including HTML views, PDF and ePub downloads, according to the available data) and Abstracts Views on Vision4Press platform.
Data correspond to usage on the plateform after 2015. The current usage metrics is available 48-96 hours after online publication and is updated daily on week days.
Initial download of the metrics may take a while.