Fig. 5.
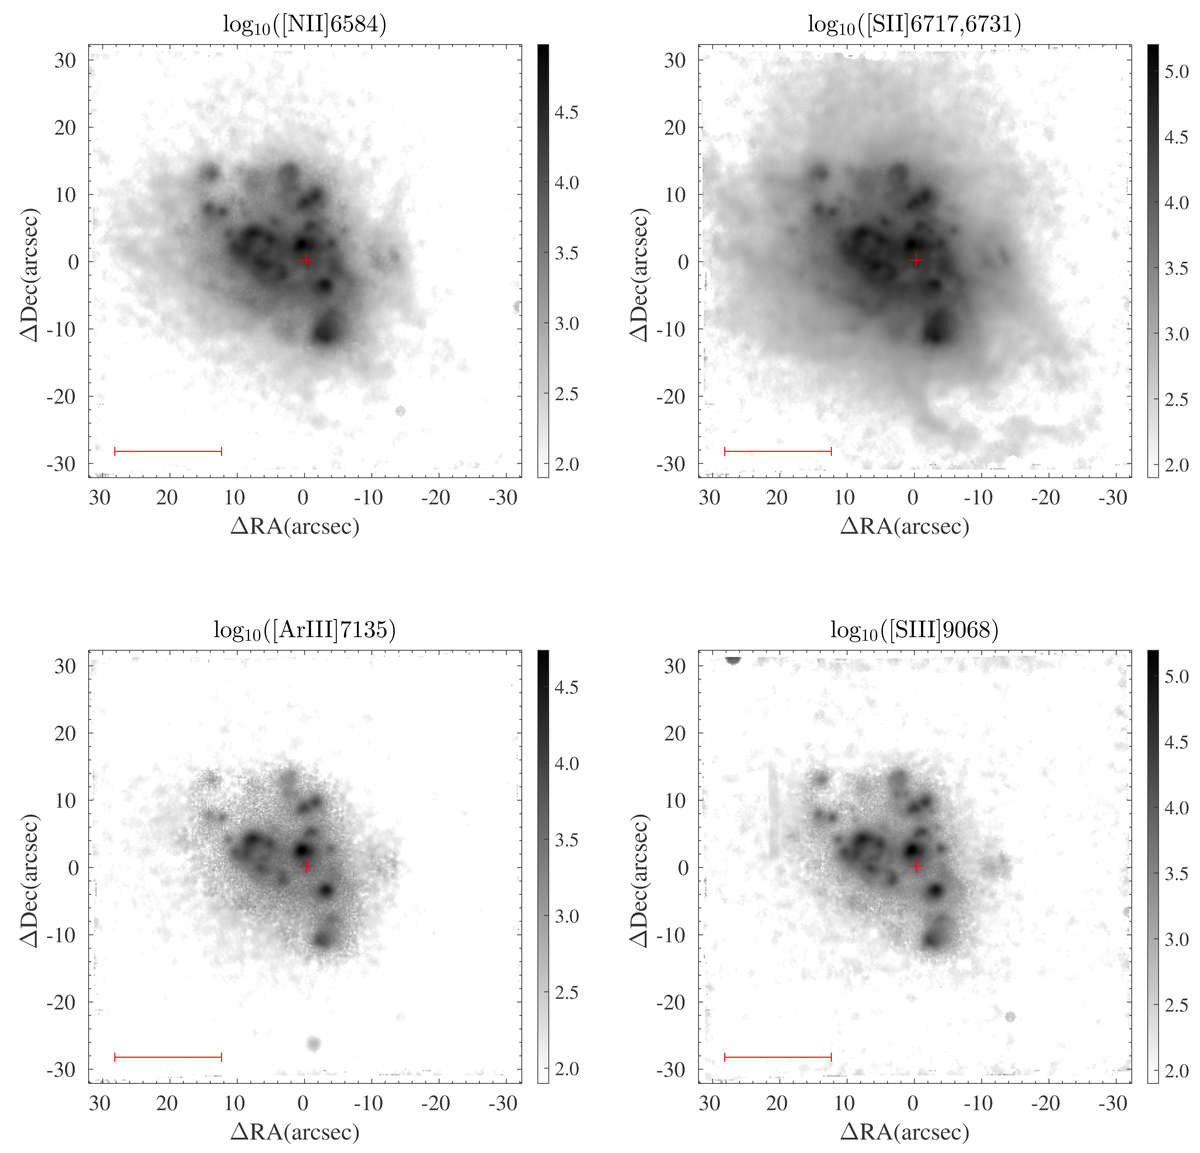
Download original image
Emission-line flux maps of Haro 14. Top left: [N II] λ6584. Top right: [S II] λλ6717, 6731. Bottom left: [Ar III] λ7135. Bottom right: [S III] λ9068. The maps are in logarithmic scale and flux units are 10−20 erg s−1 cm−2 arcsec−2. The red cross indicates the position of the continuum peak and the red line (bottom left) corresponds to 1 kpc.
Current usage metrics show cumulative count of Article Views (full-text article views including HTML views, PDF and ePub downloads, according to the available data) and Abstracts Views on Vision4Press platform.
Data correspond to usage on the plateform after 2015. The current usage metrics is available 48-96 hours after online publication and is updated daily on week days.
Initial download of the metrics may take a while.