Fig. 3.
Download original image
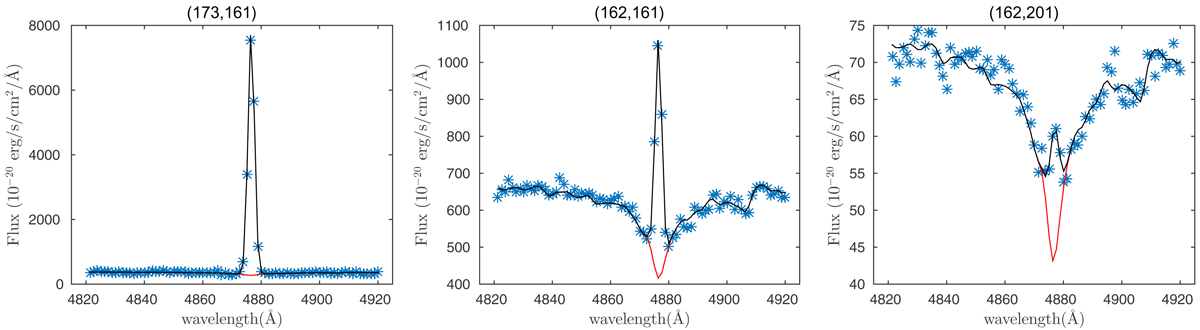
Example fits to the observed spectrum (asterisks) in the vicinity of the Hβ line at three positions in the map (spaxel coordinates on top), illustrating where the emission line is dominant (left panel), severely affected by underlying stellar absorption (central panel), and subdominant (right panel). Red line: stellar component. Black line: stellar plus emission (Gaussian) component.
Current usage metrics show cumulative count of Article Views (full-text article views including HTML views, PDF and ePub downloads, according to the available data) and Abstracts Views on Vision4Press platform.
Data correspond to usage on the plateform after 2015. The current usage metrics is available 48-96 hours after online publication and is updated daily on week days.
Initial download of the metrics may take a while.