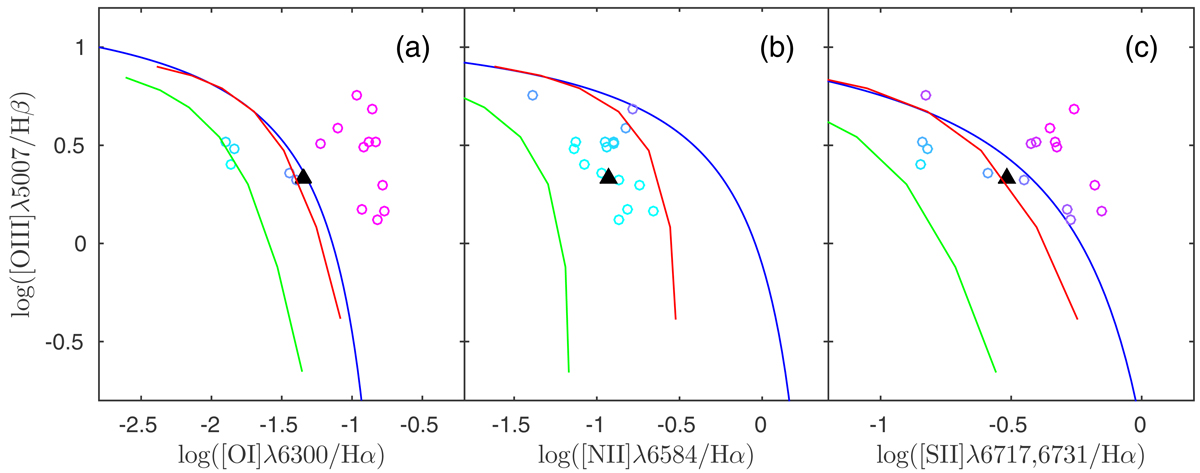
Fig. 13.
Download original image
As in Fig. 10, but for the integrated spectra of the high-excitation blobs. The solid blue line in the panels delineates the theoretical “maximum starburst line” derived by Kewley et al. (2001a). The black triangles indicate the diagnostic ratios for the integrated spectrum of the whole galaxy. The red and green lines are the photoionization models from Kewley et al. (2001a) for metallicities 0.5 Z⊙ and 0.2 Z⊙.
Current usage metrics show cumulative count of Article Views (full-text article views including HTML views, PDF and ePub downloads, according to the available data) and Abstracts Views on Vision4Press platform.
Data correspond to usage on the plateform after 2015. The current usage metrics is available 48-96 hours after online publication and is updated daily on week days.
Initial download of the metrics may take a while.