Open Access
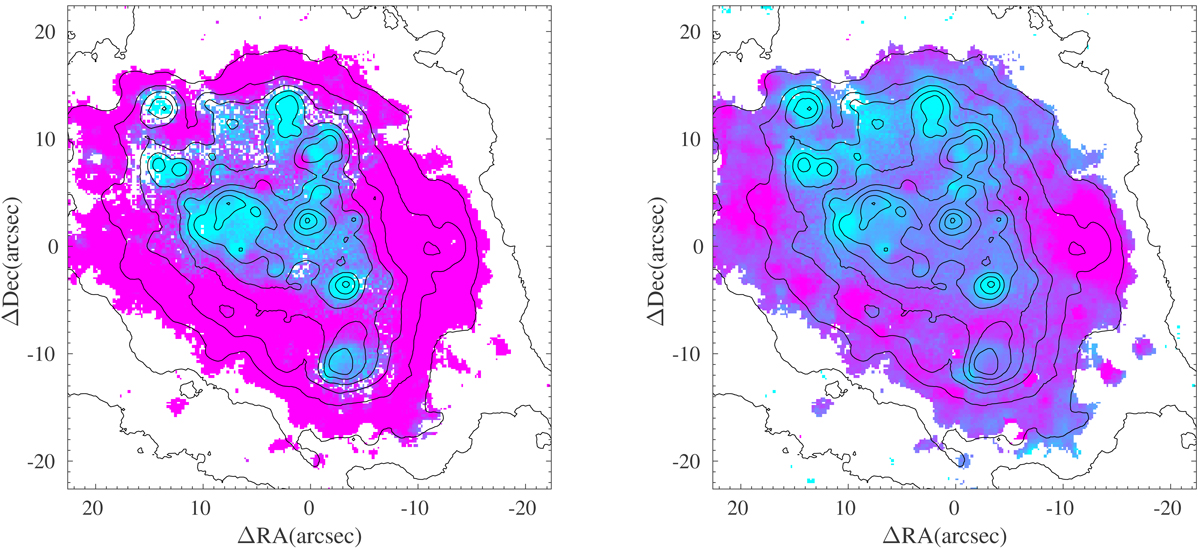
Fig. 11.
Download original image
Spaxels represented in the diagnostic diagrams of Haro 14 localized on the galaxy, following the color code in Fig. 10. Contours in Hα are overplotted. Left: spaxels in the [O I] diagram: the largest fraction of the area is being ionized by a mechanism different from SF. Right: spaxels in the [S II] diagram.
Current usage metrics show cumulative count of Article Views (full-text article views including HTML views, PDF and ePub downloads, according to the available data) and Abstracts Views on Vision4Press platform.
Data correspond to usage on the plateform after 2015. The current usage metrics is available 48-96 hours after online publication and is updated daily on week days.
Initial download of the metrics may take a while.