Free Access
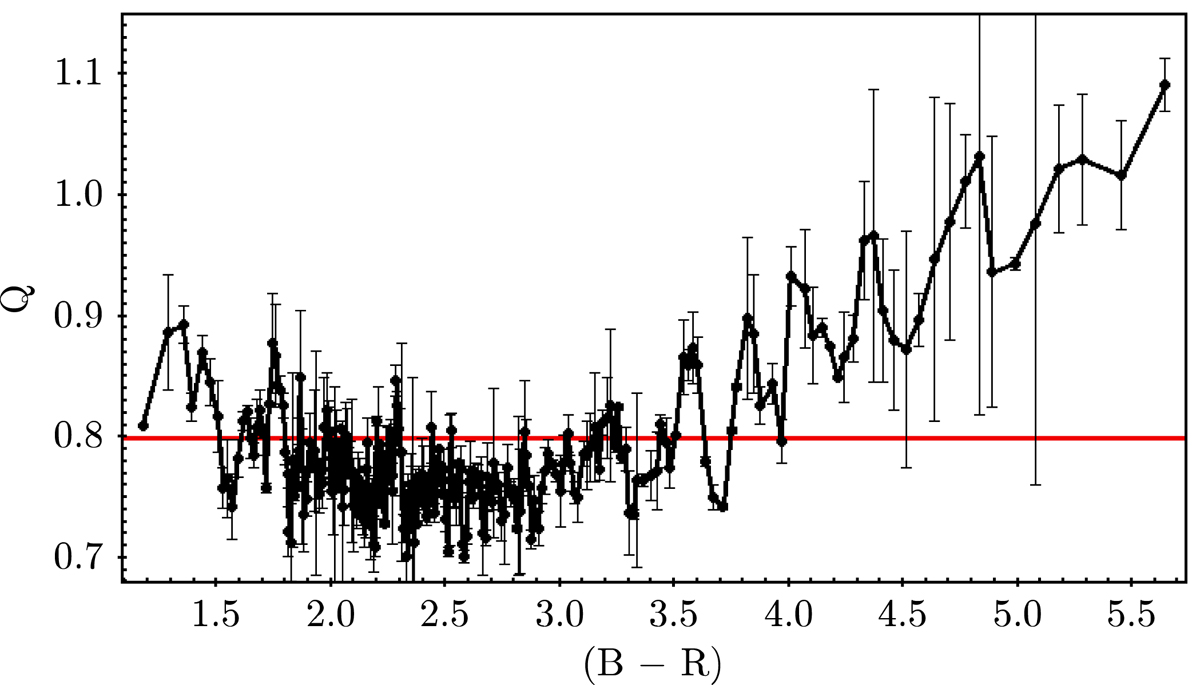
Fig. 9.
Download original image
Q spatial concentration parameter as a function of colour. Error bars have been obtained by bootstrapping. Q ≈ 0.8 separates the clumpy and central spatial distributions. The higher Q is, the more spatially concentrated the distributions. This plot reinforces the conclusions derived from Fig. 8.
Current usage metrics show cumulative count of Article Views (full-text article views including HTML views, PDF and ePub downloads, according to the available data) and Abstracts Views on Vision4Press platform.
Data correspond to usage on the plateform after 2015. The current usage metrics is available 48-96 hours after online publication and is updated daily on week days.
Initial download of the metrics may take a while.