Fig. 4.
Download original image
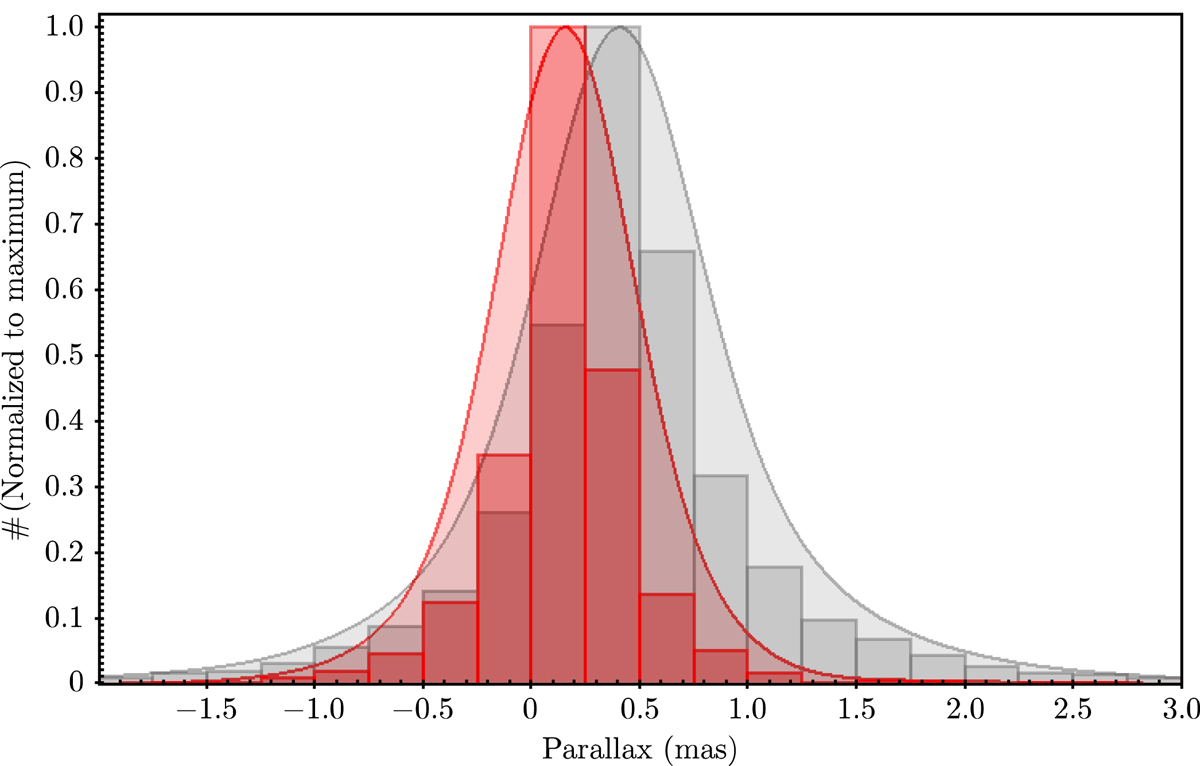
Histogram showing the parallax distribution for the total sample (grey) and the RB stars (red). Frequency is normalised to the maximum value for better visualising the difference in modes. Attending to the histogram, this difference is 0.25 mas (bin size). Kernel density estimators lead to a slightly shorter separation of ≈0.20 mas.
Current usage metrics show cumulative count of Article Views (full-text article views including HTML views, PDF and ePub downloads, according to the available data) and Abstracts Views on Vision4Press platform.
Data correspond to usage on the plateform after 2015. The current usage metrics is available 48-96 hours after online publication and is updated daily on week days.
Initial download of the metrics may take a while.