Free Access
Fig. 3.
Download original image
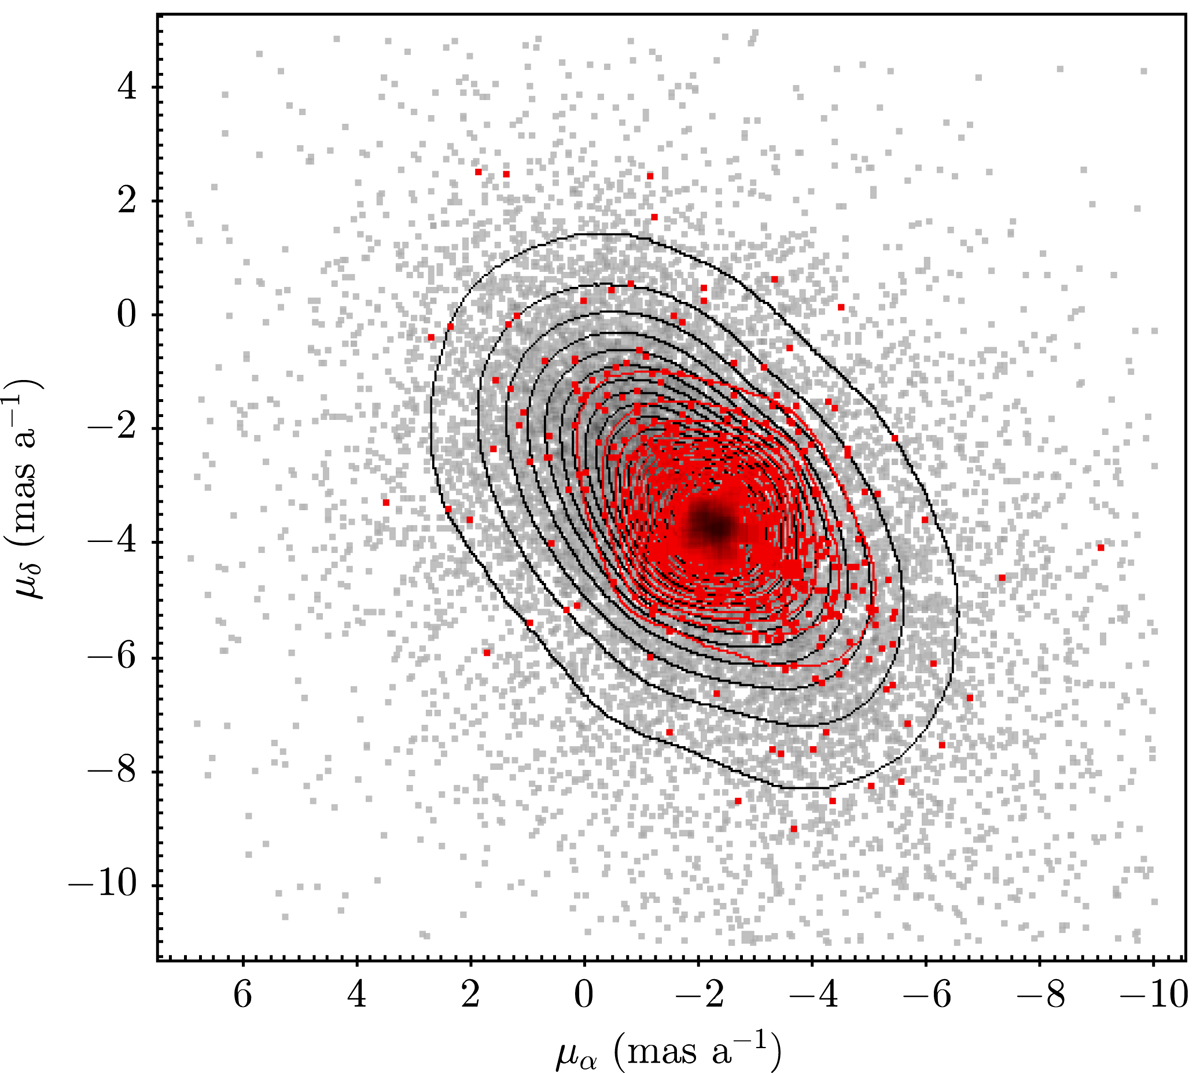
Isodensity contours (black line) of the total sample (grey small dots). Red dots are RB stars, which are in an eccentric position with respect to the whole sample distribution. They appear centred on one focus of the internal dispersion ellipse.
Current usage metrics show cumulative count of Article Views (full-text article views including HTML views, PDF and ePub downloads, according to the available data) and Abstracts Views on Vision4Press platform.
Data correspond to usage on the plateform after 2015. The current usage metrics is available 48-96 hours after online publication and is updated daily on week days.
Initial download of the metrics may take a while.