Free Access
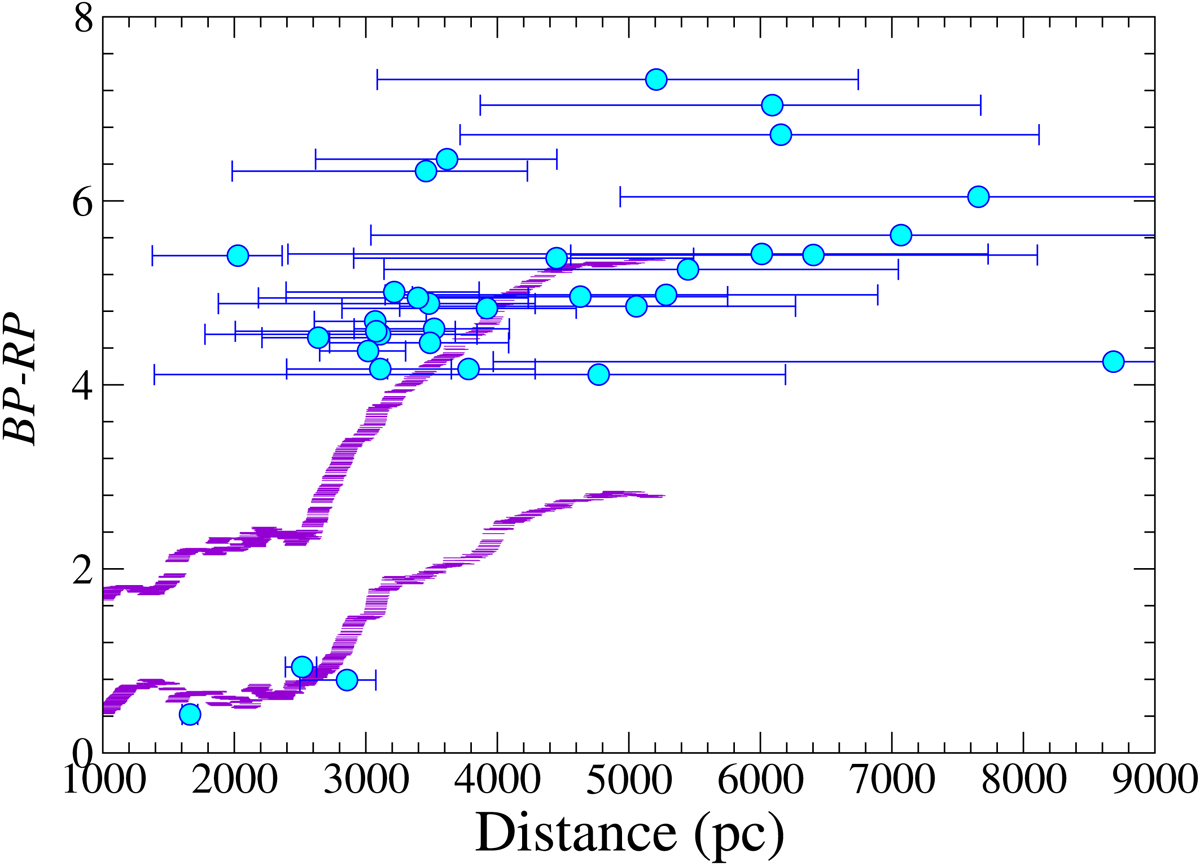
Fig. 21.
Download original image
As in Fig. 19, but for the sample of “blue” stars observed spectroscopically (cluster members are not included). The thick discontinuous lines represent the running standard deviation from Fig. 19, which suggests that the distances in Bailer-Jones et al. (2021) for our sample may be underestimated.
Current usage metrics show cumulative count of Article Views (full-text article views including HTML views, PDF and ePub downloads, according to the available data) and Abstracts Views on Vision4Press platform.
Data correspond to usage on the plateform after 2015. The current usage metrics is available 48-96 hours after online publication and is updated daily on week days.
Initial download of the metrics may take a while.