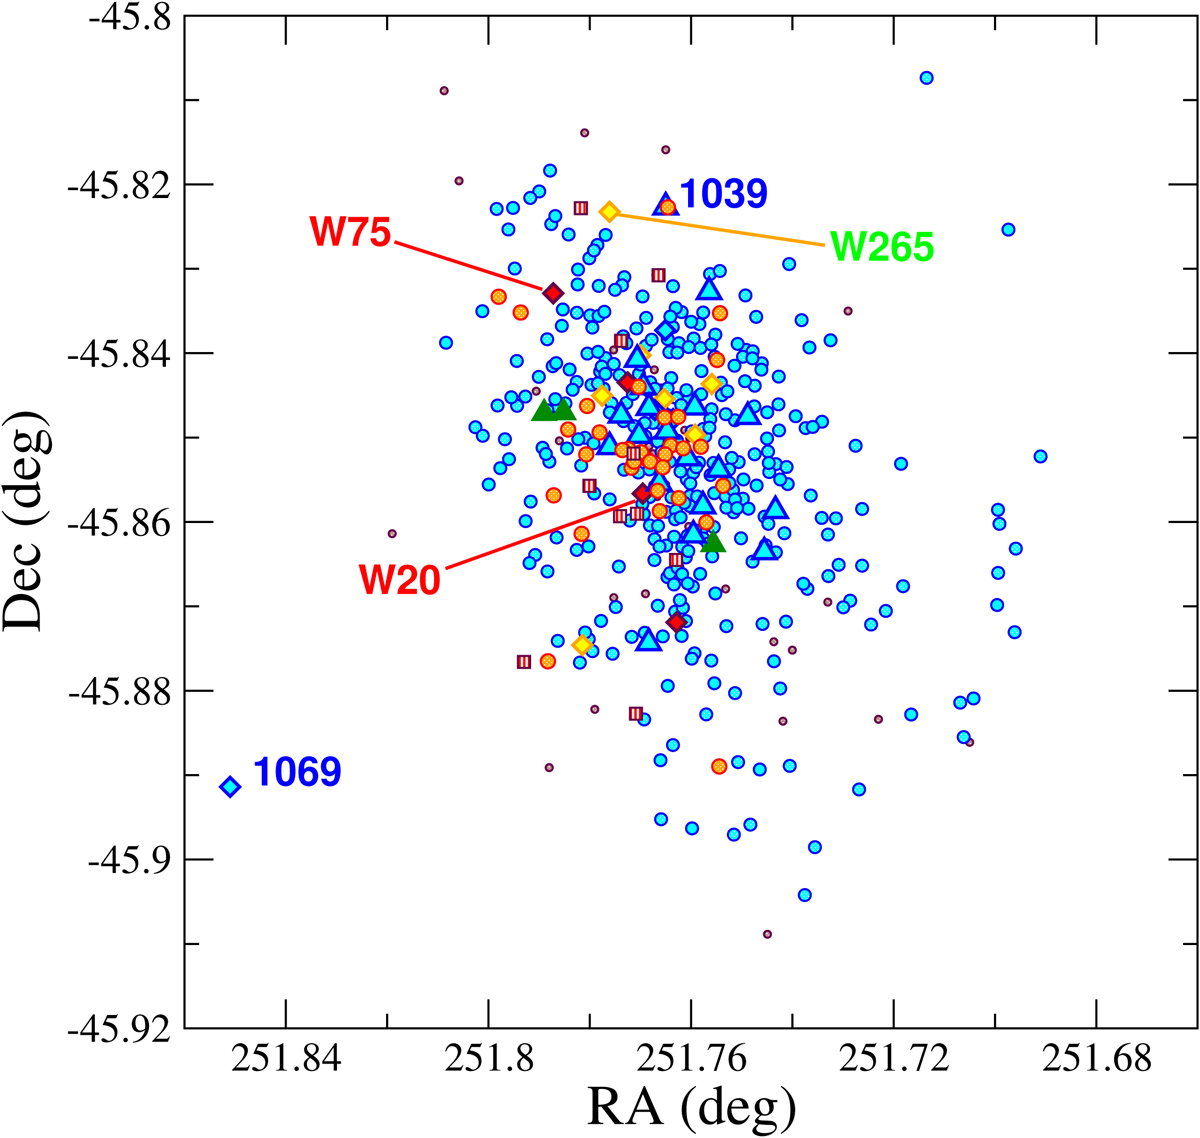
Fig. 18.
Download original image
Spatial distribution for the objects shown in Fig. 17 (symbols as in that figure). The spatial concentration of the orange circles, presumably high-reddening OB stars, stands out. A few objects of interest discussed in the text are labelled. Wd1-1039 is the only object with two labels, as it is both a Ia supergiant and a highly reddened star (Wd1-1069 is much more heavily reddened, but is not marked with an orange circle, as it lies outside the main distribution). A handful of the members in Clark et al. (2020) are outside the area shown.
Current usage metrics show cumulative count of Article Views (full-text article views including HTML views, PDF and ePub downloads, according to the available data) and Abstracts Views on Vision4Press platform.
Data correspond to usage on the plateform after 2015. The current usage metrics is available 48-96 hours after online publication and is updated daily on week days.
Initial download of the metrics may take a while.