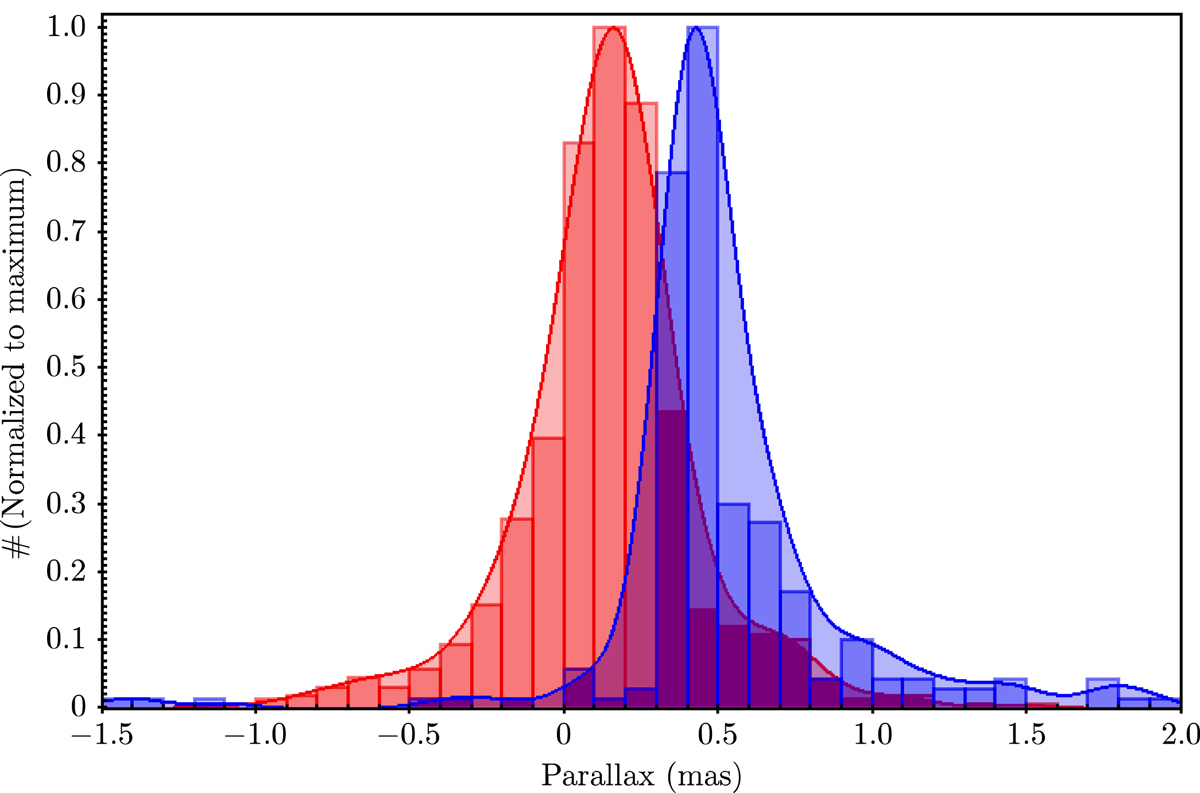
Fig. 12.
Download original image
Histogram of corrected (see Sect. 4.1 for parallax bias corrections) Gaia EDR3 parallaxes for the RG (red) and BG (blue) groups, showing two different statistical distributions. RG shows smaller parallaxes than BG. This result, together with those shown in Figs. 8–12, strongly suggests that both populations are well separated by colour, position, kinematics, and distance. Gaussian Kernel density estimators are also drawn.
Current usage metrics show cumulative count of Article Views (full-text article views including HTML views, PDF and ePub downloads, according to the available data) and Abstracts Views on Vision4Press platform.
Data correspond to usage on the plateform after 2015. The current usage metrics is available 48-96 hours after online publication and is updated daily on week days.
Initial download of the metrics may take a while.