Free Access
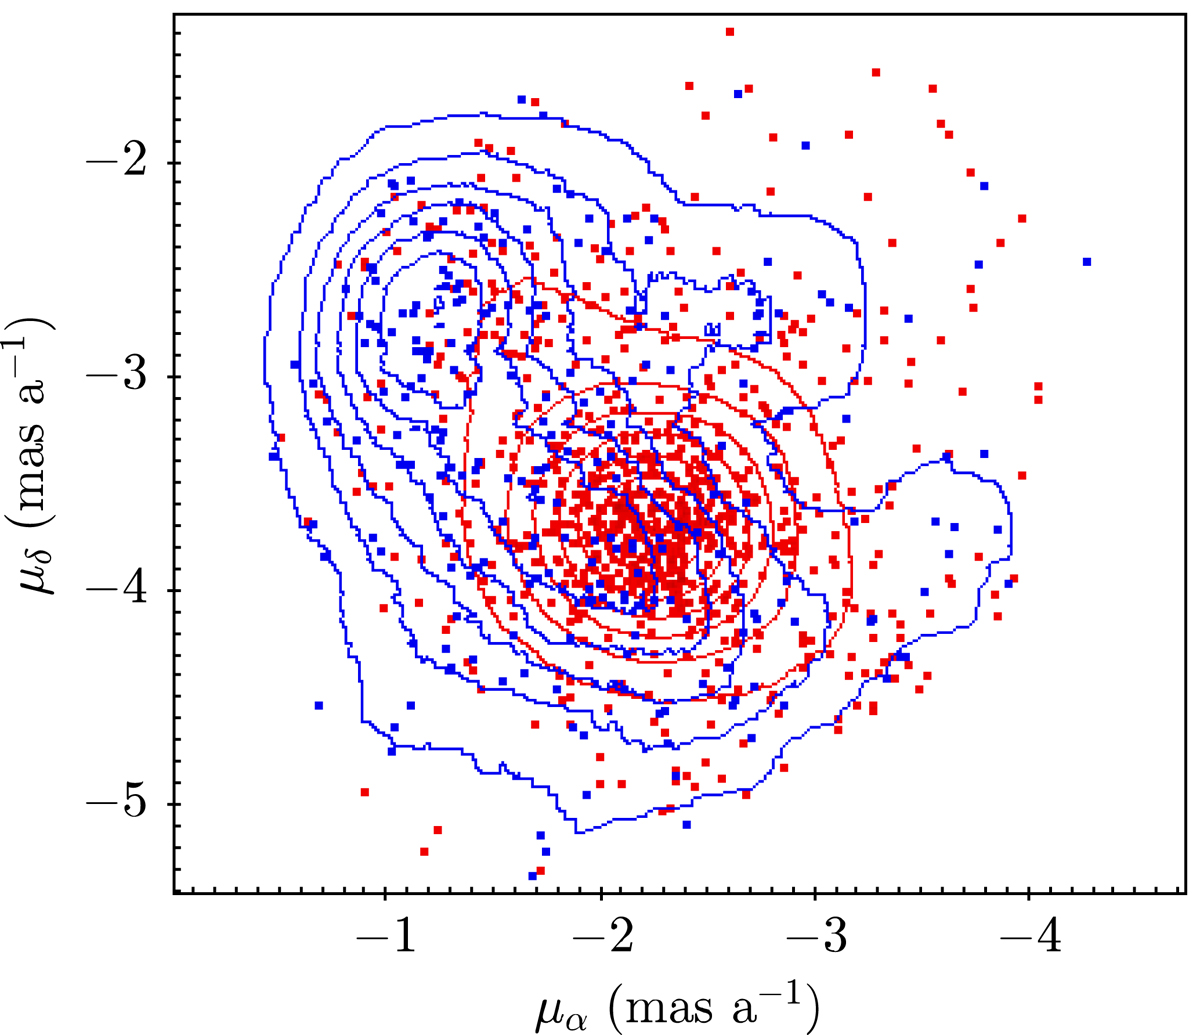
Fig. 11.
Download original image
Stars and isodensity contours in proper motion space for the two groups spatially segregated by (BP − RP). Symbols and colours as in Fig. 10. The spatial segregation by colour is mimicked in the VPD. Although both distributions show a non-null overlap, their density maxima are well separated in proper motion.
Current usage metrics show cumulative count of Article Views (full-text article views including HTML views, PDF and ePub downloads, according to the available data) and Abstracts Views on Vision4Press platform.
Data correspond to usage on the plateform after 2015. The current usage metrics is available 48-96 hours after online publication and is updated daily on week days.
Initial download of the metrics may take a while.