Fig. 10.
Download original image
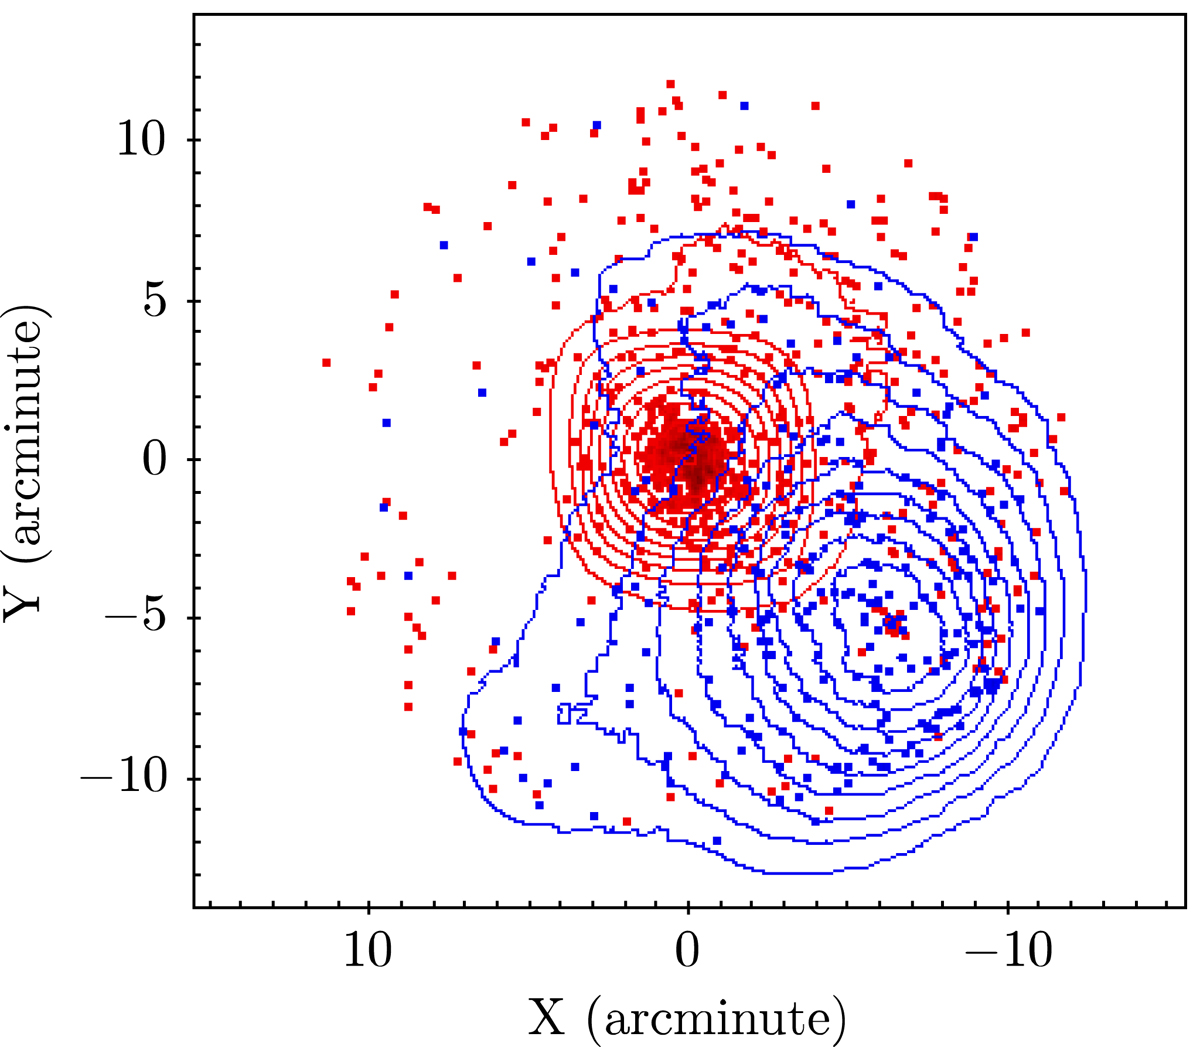
Stars (dots) and isodensity contours (lines) for the two groups spatially segregated by (BP − RP). BG (in blue) contains the objects in segregated bins with colour bluer than 1.5. RG (in red) is the same for colours redder than 4. The RG is mainly associated with the cluster centre, while the BG shows a stellar population with its maximum density well separated from the core of Wd 1. The axes show angular distances in equatorial coordinates.
Current usage metrics show cumulative count of Article Views (full-text article views including HTML views, PDF and ePub downloads, according to the available data) and Abstracts Views on Vision4Press platform.
Data correspond to usage on the plateform after 2015. The current usage metrics is available 48-96 hours after online publication and is updated daily on week days.
Initial download of the metrics may take a while.