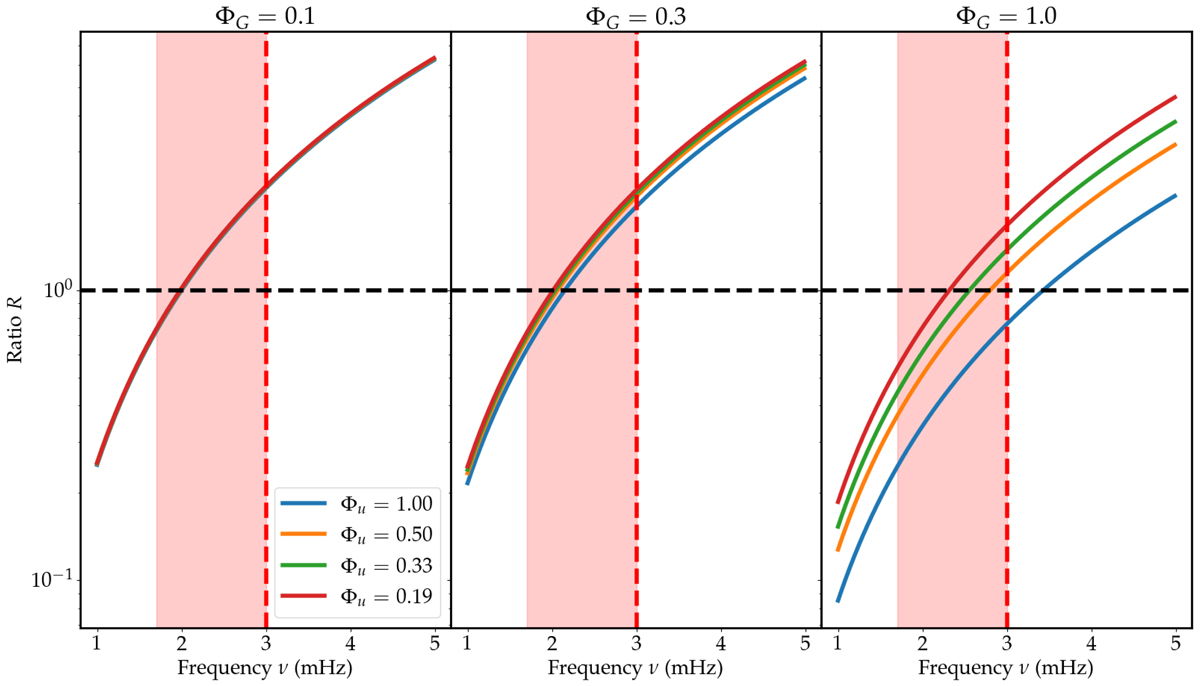
Fig. 1.
Download original image
Ratio between the two physical contributions to either mode damping or the modal surface effect (turbulent pressure vs. turbulent dissipation and redistribution of kinetic energy), as a function of mode frequency. Each panel corresponds to a fixed value of the drift tensor anisotropy, ΦG, and the colour code refers to the turbulent velocity anisotropy factor, Φu. In particular, Φu = 1 corresponds to the isotropic case, and Φu = 0.5 corresponds to the anisotropy measured in 3D large-eddy simulations (e.g., Samadi et al. 2003). The turbulent frequency is set to ωt = 0.03 rad.s−1. The region filled in red corresponds to the solar damping plateau, and the vertical dashed red line marks the frequency of maximum spectral height in the Sun, νmax. The horizontal line marks the threshold R = 1: above this line, the turbulent pressure contribution dominates, and below this line the joint effect of turbulent dissipation and pressure-rate-of-strain correlation prevails. The vertical axis is logarithmic.
Current usage metrics show cumulative count of Article Views (full-text article views including HTML views, PDF and ePub downloads, according to the available data) and Abstracts Views on Vision4Press platform.
Data correspond to usage on the plateform after 2015. The current usage metrics is available 48-96 hours after online publication and is updated daily on week days.
Initial download of the metrics may take a while.