Fig. 3
Download original image
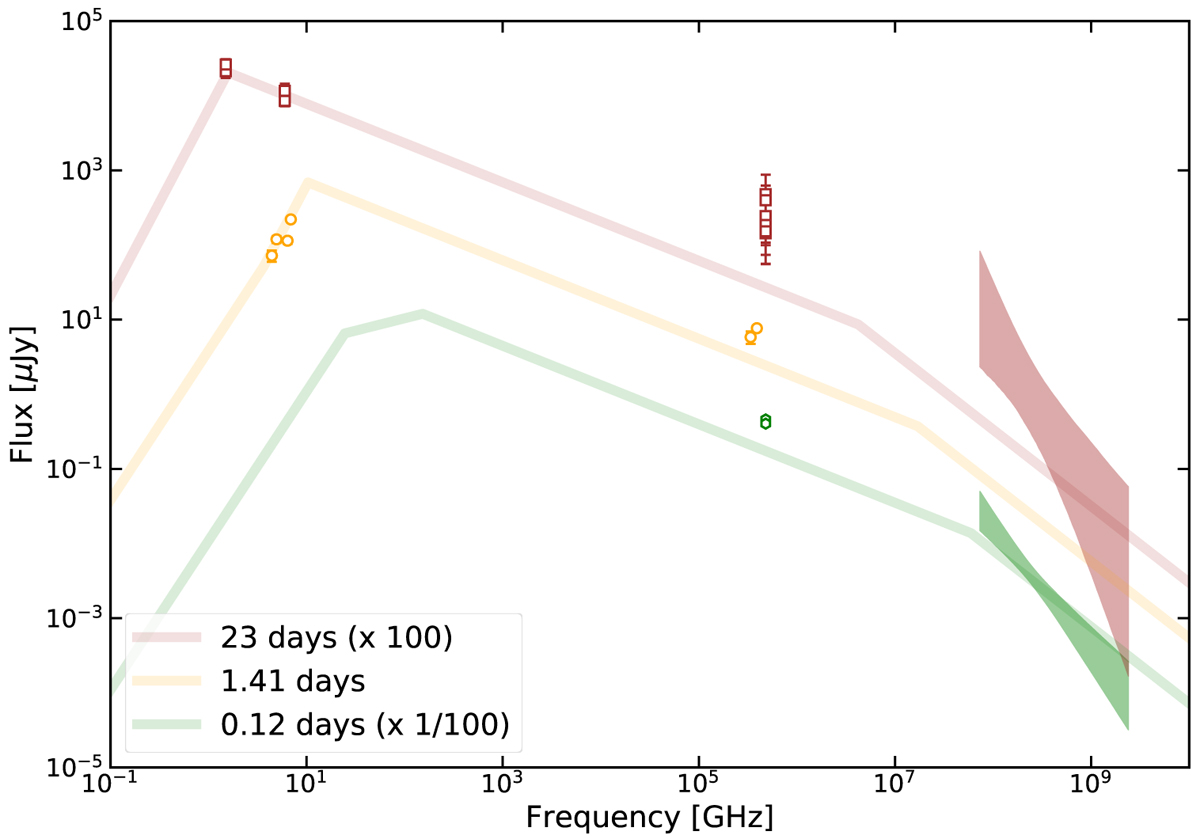
Spectra at 0.12 (green), 1.41 (orange), and 23 (brown) days after the GRB onset for a homogeneous surrounding medium with vsa = 13 GHz, vm = 6 GHz, vc = 2 × 10⁷ GHz, Fm = 800 μJy, and p = 2.05 at 1 day. Spectrum at 0.12 days: optical observations from Pozanenko et al. (2020) and XRT butterfly plot. Spectrum at 1.41 days: our VLA and MMT detections. Spectrum at 23 days: our 1.5 and 5 GHz observations, optical data from Pozanenko et al. (2020) and the XRT butterfly plot; the optical emission is dominated by the SN component.
Current usage metrics show cumulative count of Article Views (full-text article views including HTML views, PDF and ePub downloads, according to the available data) and Abstracts Views on Vision4Press platform.
Data correspond to usage on the plateform after 2015. The current usage metrics is available 48-96 hours after online publication and is updated daily on week days.
Initial download of the metrics may take a while.