Fig. 2
Download original image
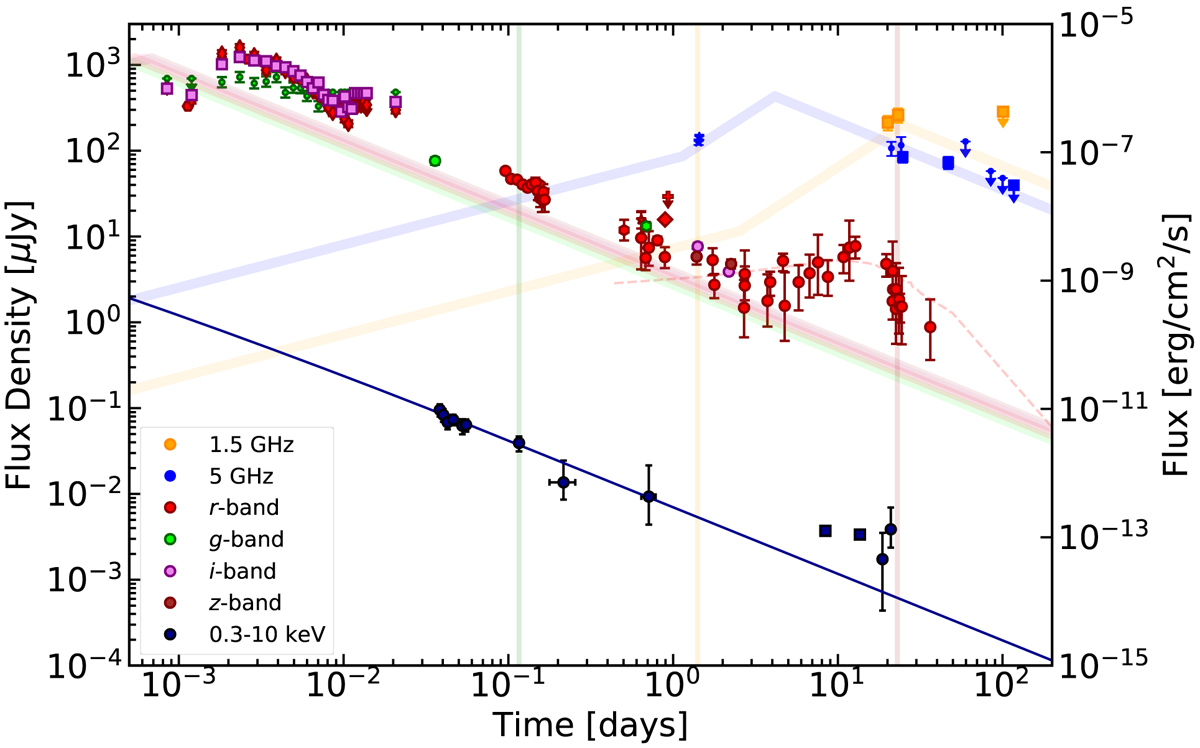
Multi-wavelength afterglow light curves (see Sect. 3). For each band, the light curves predicted by the standard model with vsa = 13 GHz, vm = 6 GHz, vc = 2 × 10⁷ GHz, Fm = 800 μJy, and p = 2.05 at 1 day for a homogeneous surrounding medium are shown: 1.5 GHz (orange); 5 GHz (blue); r, g, i, and z bands (red, lime, violet, and brown, respectively); integrated X-ray light curve (dark blue). The green, orange, and brown vertical lines pinpoint the epochs of the spectra at 0.12, 1.41, and 23 days, respectively (see also Fig. 3). The dashed line shows a simple model for the SN contribution in the r band (see Sect. 5.1).
Current usage metrics show cumulative count of Article Views (full-text article views including HTML views, PDF and ePub downloads, according to the available data) and Abstracts Views on Vision4Press platform.
Data correspond to usage on the plateform after 2015. The current usage metrics is available 48-96 hours after online publication and is updated daily on week days.
Initial download of the metrics may take a while.