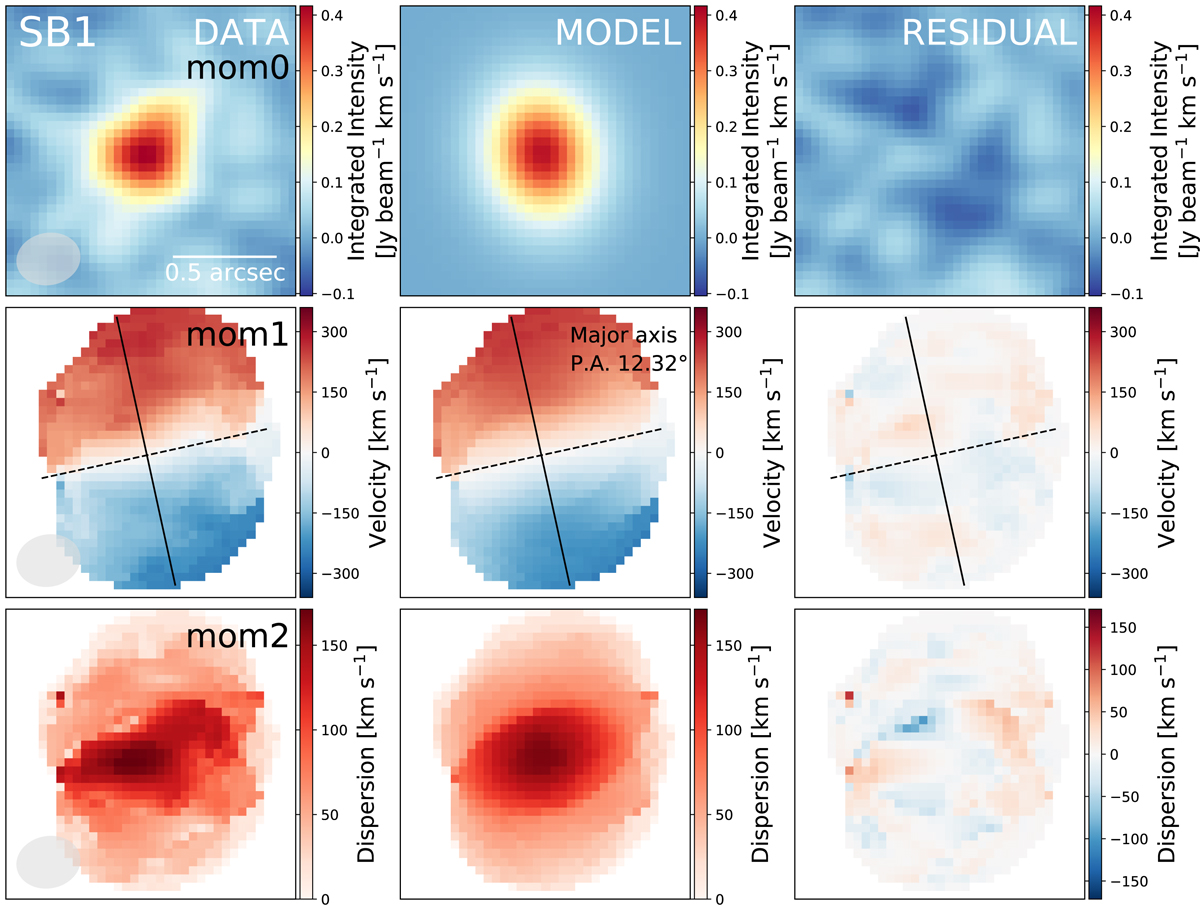
Fig. A.1.
Download original image
Comparison between the data and the best-fit model for the SB1. From top to bottom, this figure shows velocity-integrated CO(3−2) flux density (Moment 0), velocity field (Moment 1), and velocity dispersion (Moment 2) maps for the data (left panel); the best-fit model (middle panel); and the residual after subtracting the model from the data (right panel). Gray-filled ellipses in the bottom-left corner indicate the angular resolution of 0.31″ × 0.25″. Each panel is 1.4″ × 1.4″, with the north being up and the east to the left.
Current usage metrics show cumulative count of Article Views (full-text article views including HTML views, PDF and ePub downloads, according to the available data) and Abstracts Views on Vision4Press platform.
Data correspond to usage on the plateform after 2015. The current usage metrics is available 48-96 hours after online publication and is updated daily on week days.
Initial download of the metrics may take a while.