Fig. 5.
Download original image
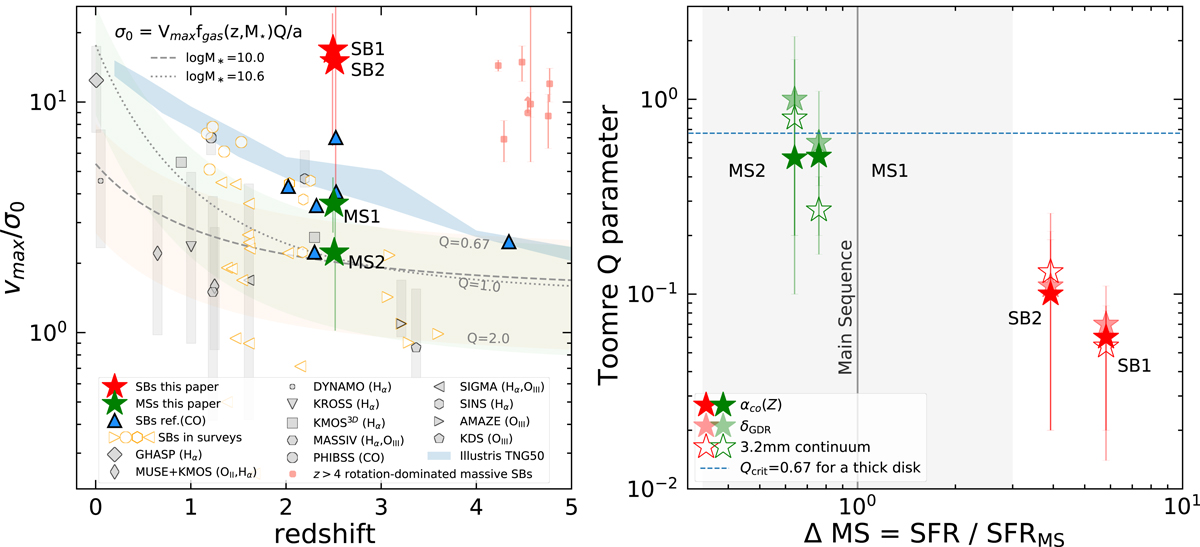
Two cluster SBs have dynamically cold and gravitationally unstable gas disks. Left: ratio of the gas rotational to random motion (Vmax/σ0) as a function of redshift, with the comparison between the two cluster SBs and two cluster MSs and samples of observed and simulated field galaxies. The two cluster SBs and two cluster MSs are in red and green stars, respectively, with uncertainties derived from our simulation (see Sect. 3.6). Filled gray symbols with vertical bars show the median values and 16–84th percentile range of field star-forming galaxies, including molecular and ionized gas detections. When possible, we identified field starbursts (orange symbols) within these literature samples at z > 1 as galaxies with a SFR at least 0.5 dex higher than the SFMS. Blue triangles represent field starbursts with individual CO observations (Calistro Rivera et al. 2018; Barro et al. 2017; Swinbank et al. 2011; Tadaki et al. 2017, 2019). The faint red points show massive (M* > 1010 M⊙) rotation-dominated SBs at z > 4 which have been found recently (Rizzo et al. 2020, 2021; Lelli et al. 2021; Fraternali et al. 2021), but no information on their environment is available yet. The light-blue area shows Vmax/σ0 values for star-forming galaxies from Illustris-TNG50 simulations in the mass range 109–1011 M⊙ (Pillepich et al. 2019). The two lines with the light green and pink shaded regions describe Vmax/σ0 as a function of fgas and Toomre Q (Wisnioski et al. 2015), where a = ![]() for a disk with constant rotational velocity. Right: toomre parameter Q (see Sect. 4.2) as a function of the main-sequence offset. The solid gray line and shaded area highlight the SFMS (Schreiber et al. 2015) position and the ±3 × ΔMS region, commonly used to separate MS from SB galaxies. We note that the two MSs have the same ΔMS of 0.7 and are drawn staggered by 0.1 in this figure in order to distinguish between them. The Q values calculated using the 3.2 mm dust continuum, the δGDR, and the CO-based gas masses with αCO(Z) are shown by opened, filled light, and filled dark stars, respectively. The blue dashed line indicates the threshold Qcrit = 0.67 below which a thick disk (as assumed in our gas kinematic model) becomes gravitationally unstable.
for a disk with constant rotational velocity. Right: toomre parameter Q (see Sect. 4.2) as a function of the main-sequence offset. The solid gray line and shaded area highlight the SFMS (Schreiber et al. 2015) position and the ±3 × ΔMS region, commonly used to separate MS from SB galaxies. We note that the two MSs have the same ΔMS of 0.7 and are drawn staggered by 0.1 in this figure in order to distinguish between them. The Q values calculated using the 3.2 mm dust continuum, the δGDR, and the CO-based gas masses with αCO(Z) are shown by opened, filled light, and filled dark stars, respectively. The blue dashed line indicates the threshold Qcrit = 0.67 below which a thick disk (as assumed in our gas kinematic model) becomes gravitationally unstable.
Current usage metrics show cumulative count of Article Views (full-text article views including HTML views, PDF and ePub downloads, according to the available data) and Abstracts Views on Vision4Press platform.
Data correspond to usage on the plateform after 2015. The current usage metrics is available 48-96 hours after online publication and is updated daily on week days.
Initial download of the metrics may take a while.