Fig. 4.
Download original image
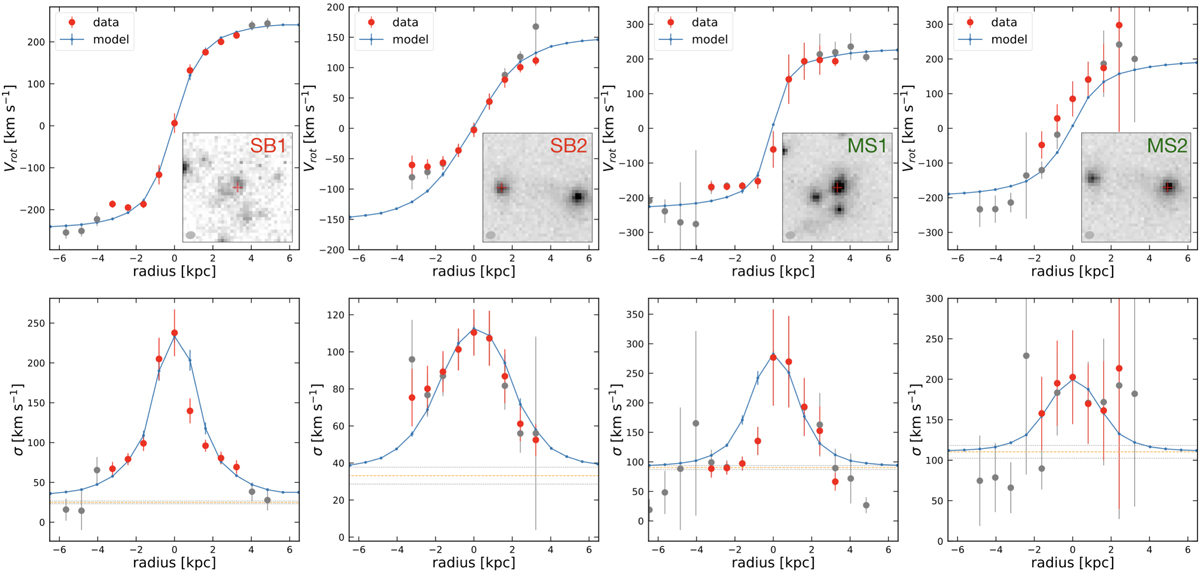
Observations (points) and best-fit PSF-convolved models (blue lines) for rotation velocity and total velocity dispersion profiles along the kinematic major axis. Each point was extracted from the spectrum in an aperture whose diameter is equal to the angular resolution 0.31″ and the red one restricted to the spaxels with a S/N > 3 in the aperture. Orange and gray lines mark the intrinsic velocity dispersion σ0 and 1σ confidence from the GalPAK3D. The 3.5″ × 3.5″ HST/F160W images are shown in the bottom-right corner with the red crosses denote the corresponding source. Since SB2 and MS2 are close to each other with mixed fluxes, the points at the lowest radius of SB2 and the highest radius of MS2 are not fitted well with models. For MS1, the points at the lowest radius are not fitted well with models because of two neighboring sources at similar redshifts. The σ0 derived from GalPAK3D is lower than the lowest observed velocity dispersion profile because the latter one is still affected by the beam-smearing effect even at the large radii probed by our observations.
Current usage metrics show cumulative count of Article Views (full-text article views including HTML views, PDF and ePub downloads, according to the available data) and Abstracts Views on Vision4Press platform.
Data correspond to usage on the plateform after 2015. The current usage metrics is available 48-96 hours after online publication and is updated daily on week days.
Initial download of the metrics may take a while.