Open Access
Fig. 3.
Download original image
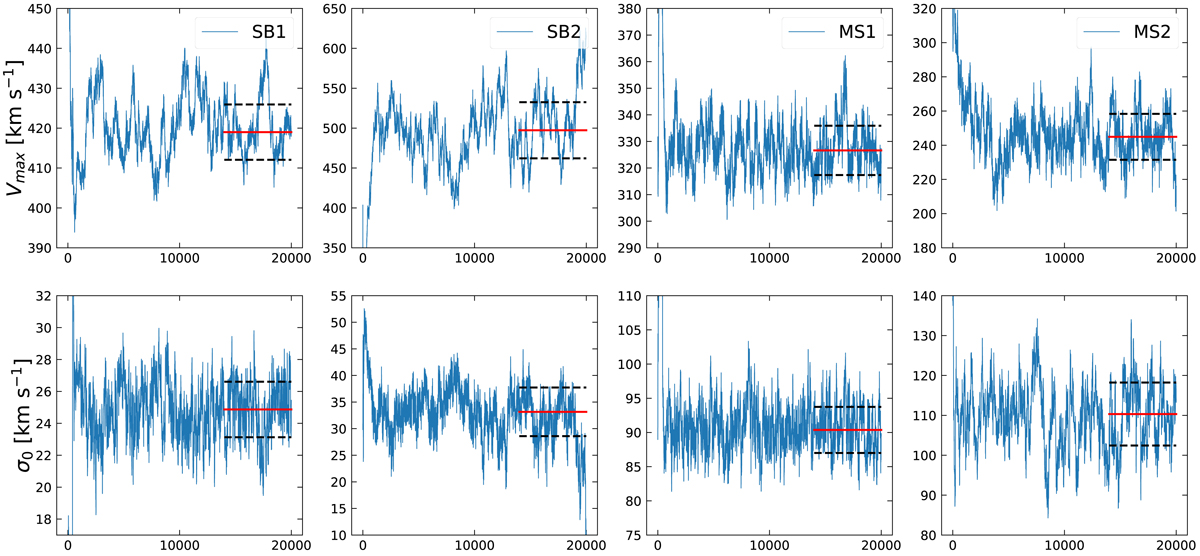
Full MCMC chain for 20 000 iterations for the two SBs and two MSs. Each galaxy shows the fitting results of rotational velocity and intrinsic velocity dispersion. Red solid lines and black dashed lines refer to the median and the 1σ standard deviations of the last 30% of the MCMC chain.
Current usage metrics show cumulative count of Article Views (full-text article views including HTML views, PDF and ePub downloads, according to the available data) and Abstracts Views on Vision4Press platform.
Data correspond to usage on the plateform after 2015. The current usage metrics is available 48-96 hours after online publication and is updated daily on week days.
Initial download of the metrics may take a while.