Fig. 1
Download original image
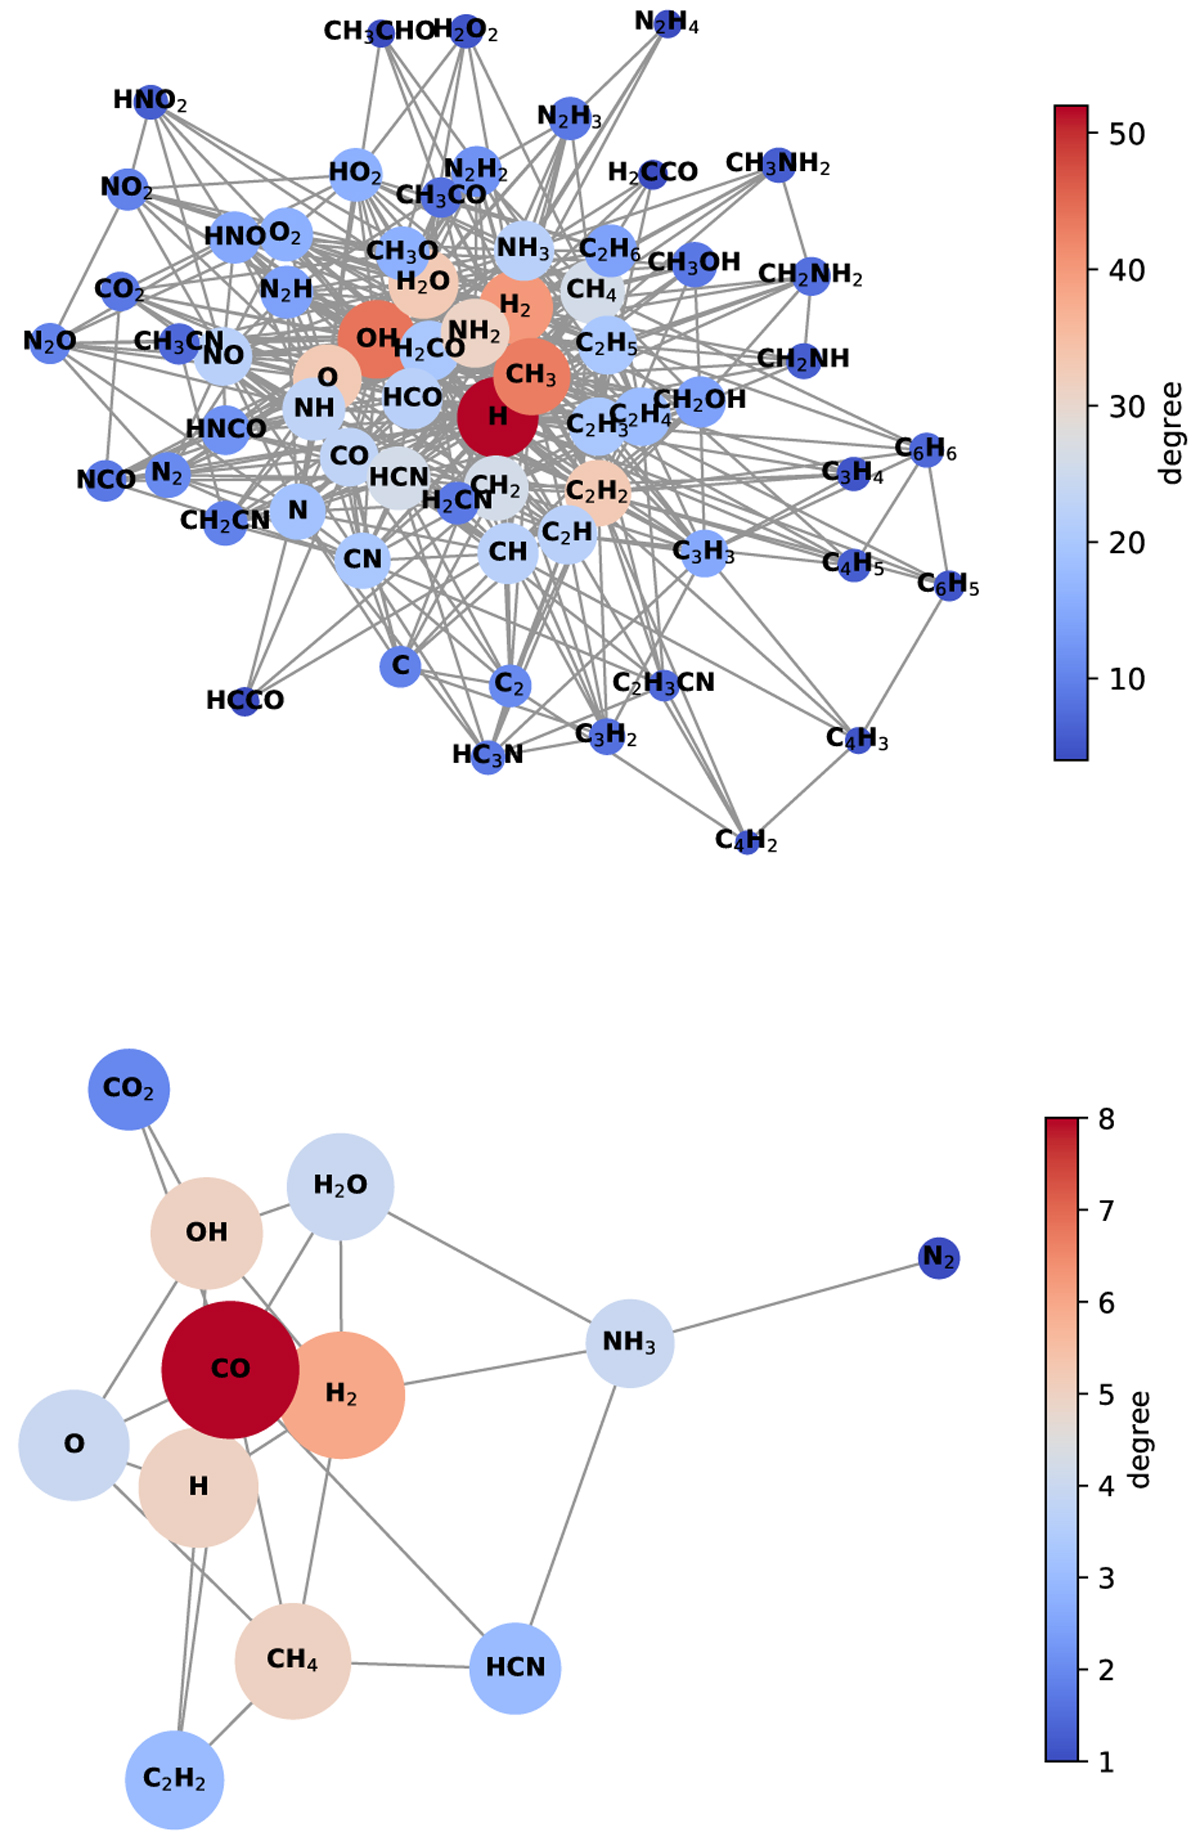
Visualization of the full chemical network from VULCAN (top) and the mini-network (bottom). Each species is represented by a node, with the color varying with the degree and the size varying with centrality. The shorter length of the edges (lines) indicates faster rates between two species (not to linear scale). The graphs are for Τ = 1000 Κ, Ρ = 1 bar, and chemical equilibrium composition.
Current usage metrics show cumulative count of Article Views (full-text article views including HTML views, PDF and ePub downloads, according to the available data) and Abstracts Views on Vision4Press platform.
Data correspond to usage on the plateform after 2015. The current usage metrics is available 48-96 hours after online publication and is updated daily on week days.
Initial download of the metrics may take a while.