Fig. 6
Download original image
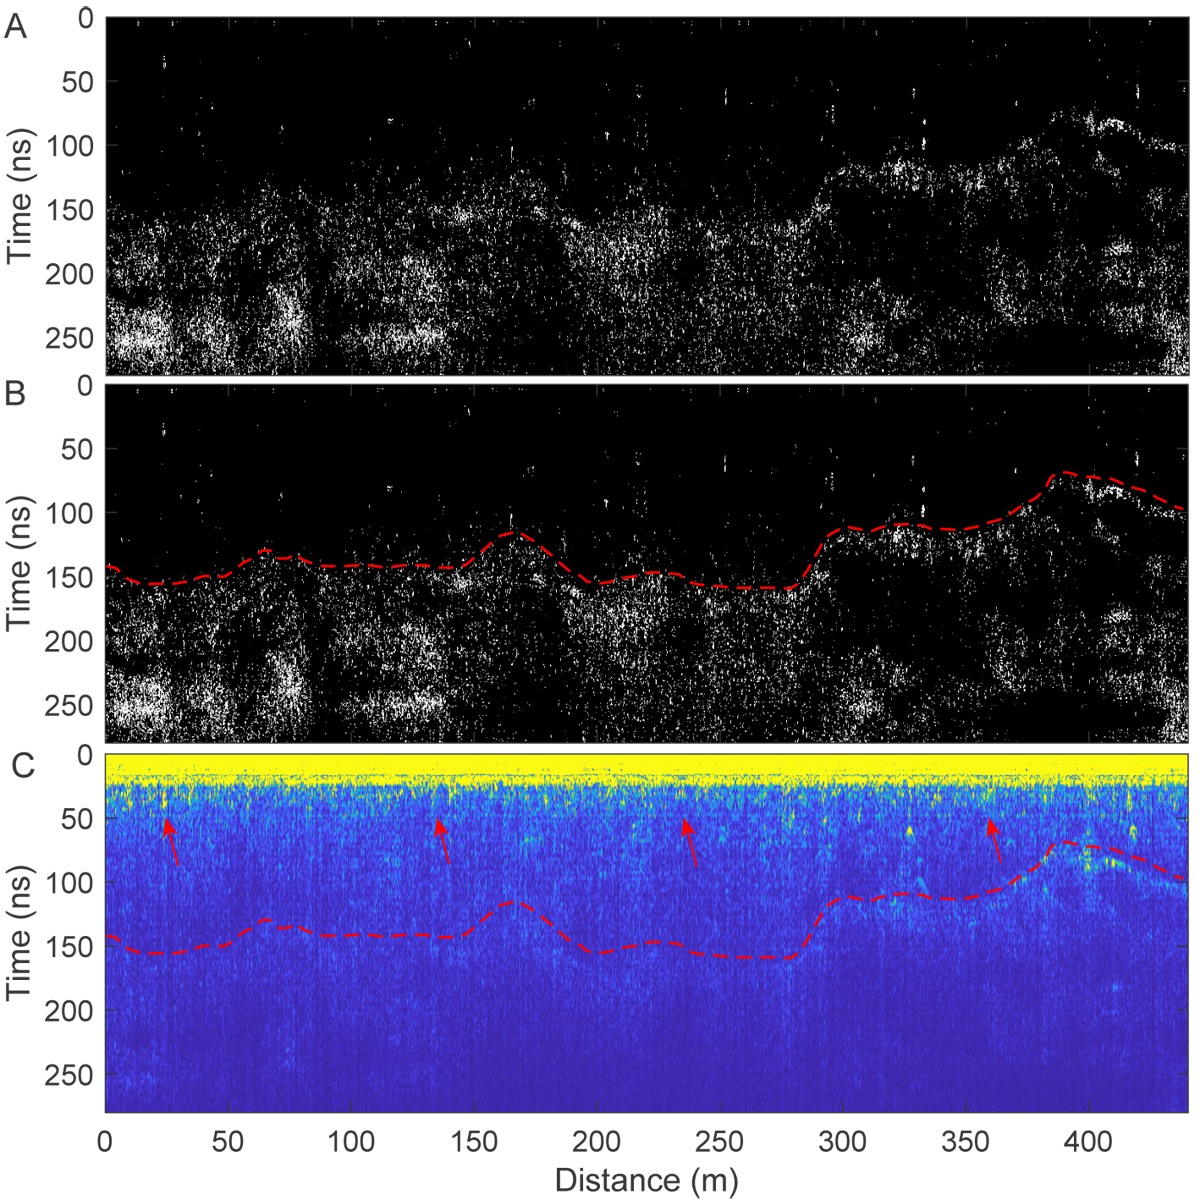
Layer identification between the fine regolith and its underlying ejecta materials in the high-frequency radargram. (A) Binarization of the radargram. The dark tone in the upper part of the figure indicates the weak radar echoes, which are interpreted as the fine lunar regolith material. (B) The red dashed curve indicates the boundary at a depth of ~12m. (C) Envelope of the radargram after Hilbert transform. The red arrows indicate the presence of the jamming echoes shown as horizontal features.
Current usage metrics show cumulative count of Article Views (full-text article views including HTML views, PDF and ePub downloads, according to the available data) and Abstracts Views on Vision4Press platform.
Data correspond to usage on the plateform after 2015. The current usage metrics is available 48-96 hours after online publication and is updated daily on week days.
Initial download of the metrics may take a while.