Fig. 2
Download original image
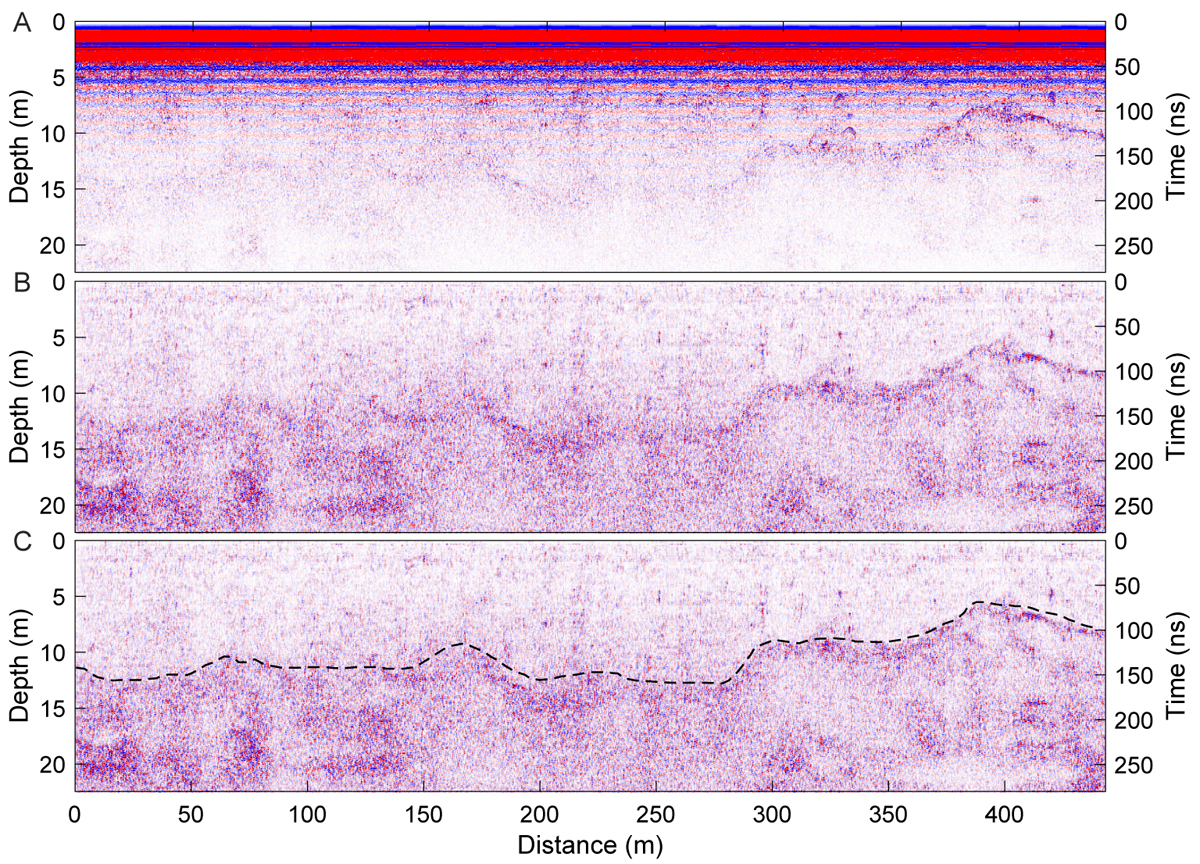
Radargram obtained by the high-frequency LPR onboard the Yutu-2 rover within its first 17 lunar days. The x-axis is the radar survey distance (m). The right y-axis is the radar echoes’ corresponding two-way traveling time (ns). The left y-axis is the derived depth (m), where the velocity of the radar pulse propagation into the lunar subsurface material was estimated to be 0.16 m/ns using the hyperbolic fitting method (Li et al. 2020). (A) The high-frequency LPR L2B radargram. (B) Processed radargram after background removal, band-pass filtering (250MHz–750MHz), and applied SEC gain for amplitude compensation. (C) The black dashed line plots the boundary between the upper fine-grained lunar regolith and the ejecta materials from the nearby craters. Our manual calculation of the dashed line is based on the amplitude of the interface reflection which has become sharply stronger, indicating the boundary of difference of materials. The average thickness of the upper fine regolith corresponds to ~12m.
Current usage metrics show cumulative count of Article Views (full-text article views including HTML views, PDF and ePub downloads, according to the available data) and Abstracts Views on Vision4Press platform.
Data correspond to usage on the plateform after 2015. The current usage metrics is available 48-96 hours after online publication and is updated daily on week days.
Initial download of the metrics may take a while.