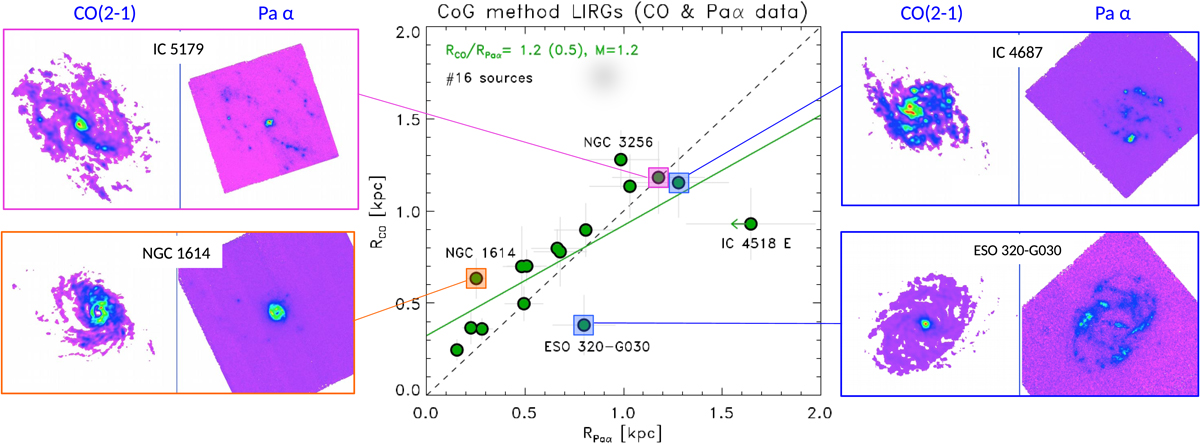
Fig. 9.
Download original image
Effective radii derived for the CO(2–1) and Paα tracers using the CoG method. The black dashed line represents the 1:1 relation. The solid green line identifies the derived best fit to the data, which was derived using a linear least squares fit. Two outliers (IC 4687 and ESO 320-G030) are identified for which the RPaα ≳ RCO, while NGC 1614 is characterized by RCO ≳ RPaα. The most extreme RPaα is derived for IC 4518 E, and considered as an upper limit (see text for details). IC 5179 is a galaxy that shows similar effective radii for both gas tracers (RPaα ∼ RCO).
Current usage metrics show cumulative count of Article Views (full-text article views including HTML views, PDF and ePub downloads, according to the available data) and Abstracts Views on Vision4Press platform.
Data correspond to usage on the plateform after 2015. The current usage metrics is available 48-96 hours after online publication and is updated daily on week days.
Initial download of the metrics may take a while.