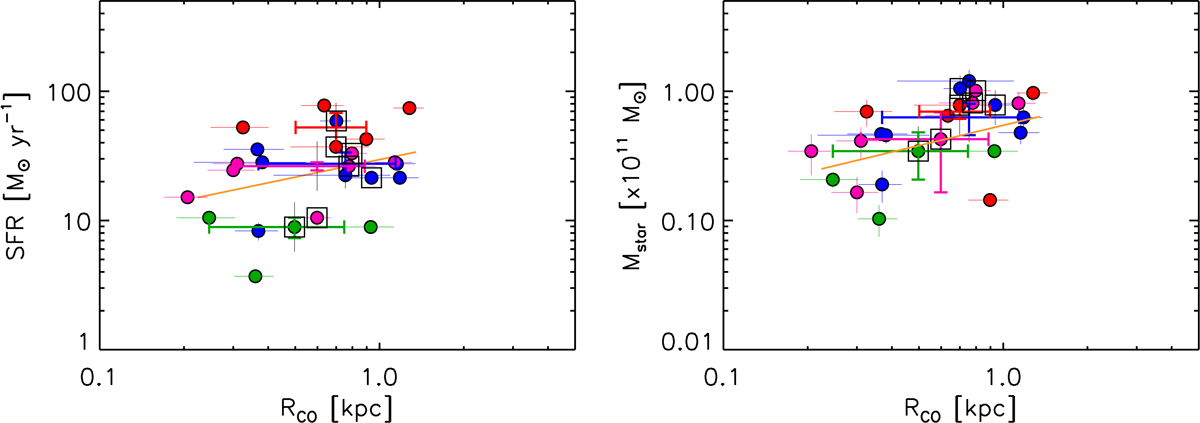
Fig. 8.
Download original image
Left: SFR as a function of effective radius RCO. Galaxies containing an AGN are surrounded by a square. A Spearman’s rank correlation coefficient ρ = 0.32 is derived (see text). Right: stellar mass Mstar versus RCO (ρ = 0.53). The different types of galaxies are identified with the same color code as that used in Fig. 7. The orange solid line represents the best fit (linear least square fit).
Current usage metrics show cumulative count of Article Views (full-text article views including HTML views, PDF and ePub downloads, according to the available data) and Abstracts Views on Vision4Press platform.
Data correspond to usage on the plateform after 2015. The current usage metrics is available 48-96 hours after online publication and is updated daily on week days.
Initial download of the metrics may take a while.