Fig. 7.
Download original image
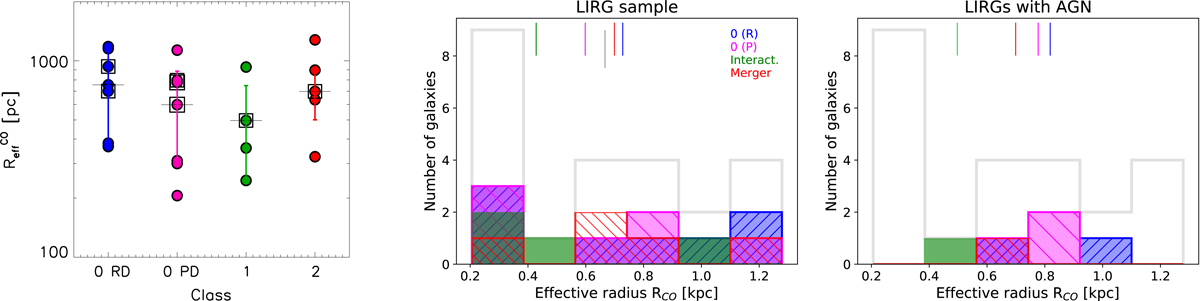
Left: CO(2–1) effective radius as a function of class. Type 0 (R), 0 (P), 1, and 2 are shown in blue, magenta, green, and red, respectively. The median RCO values (horizontal lines) are shown for each class. Empty squares identify galaxies containing an AGN. Middle:RCO distribution for the whole sample (gray solid line) and for the individual subgroups (same color code as in the left panel). The colored vertical lines in the upper part of the panel represent the median values of each distribution, following the same color code. Right:RCO distribution for the whole sample (gray solid line) and for LIRGs with an AGN.
Current usage metrics show cumulative count of Article Views (full-text article views including HTML views, PDF and ePub downloads, according to the available data) and Abstracts Views on Vision4Press platform.
Data correspond to usage on the plateform after 2015. The current usage metrics is available 48-96 hours after online publication and is updated daily on week days.
Initial download of the metrics may take a while.