Fig. 6.
Download original image
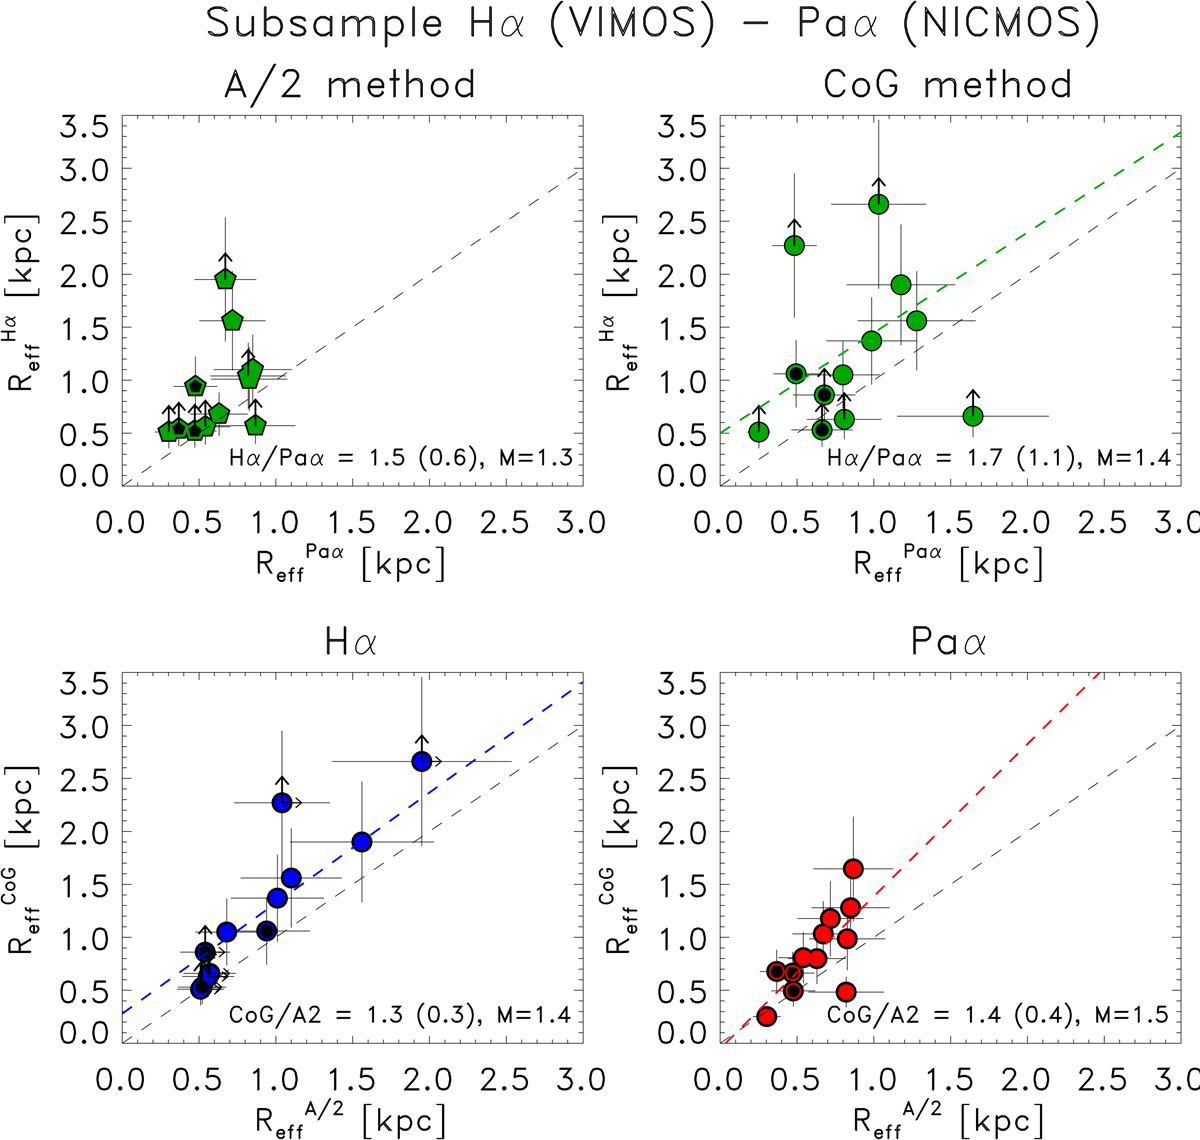
Relation between the observed (not corrected for extinction) Hα and Paα tracers when using A/2 and CoG methods applied to a subsample of 12 galaxies. Lower limits on Hα measurements are due to the limited FoV of VIMOS. Top panels: ![]() as a function of
as a function of ![]() when applying the A/2 (left) and CoG (right) methods. Bottom panels: comparison of the Reff obtained using the CoG and A/2 methods derived for the Hα (left) and Paα (right). For each plot, the mean (and standard deviation) and median (M) values are shown. Galaxies containing an AGN are identified using an additional small black symbol. The black dashed line represents the 1:1 relation between the parameters considered. The colored dashed lines identify the trend obtained using a linear least square fit for each data type, which was derived, in this case, excluding the lower limits.
when applying the A/2 (left) and CoG (right) methods. Bottom panels: comparison of the Reff obtained using the CoG and A/2 methods derived for the Hα (left) and Paα (right). For each plot, the mean (and standard deviation) and median (M) values are shown. Galaxies containing an AGN are identified using an additional small black symbol. The black dashed line represents the 1:1 relation between the parameters considered. The colored dashed lines identify the trend obtained using a linear least square fit for each data type, which was derived, in this case, excluding the lower limits.
Current usage metrics show cumulative count of Article Views (full-text article views including HTML views, PDF and ePub downloads, according to the available data) and Abstracts Views on Vision4Press platform.
Data correspond to usage on the plateform after 2015. The current usage metrics is available 48-96 hours after online publication and is updated daily on week days.
Initial download of the metrics may take a while.