Free Access
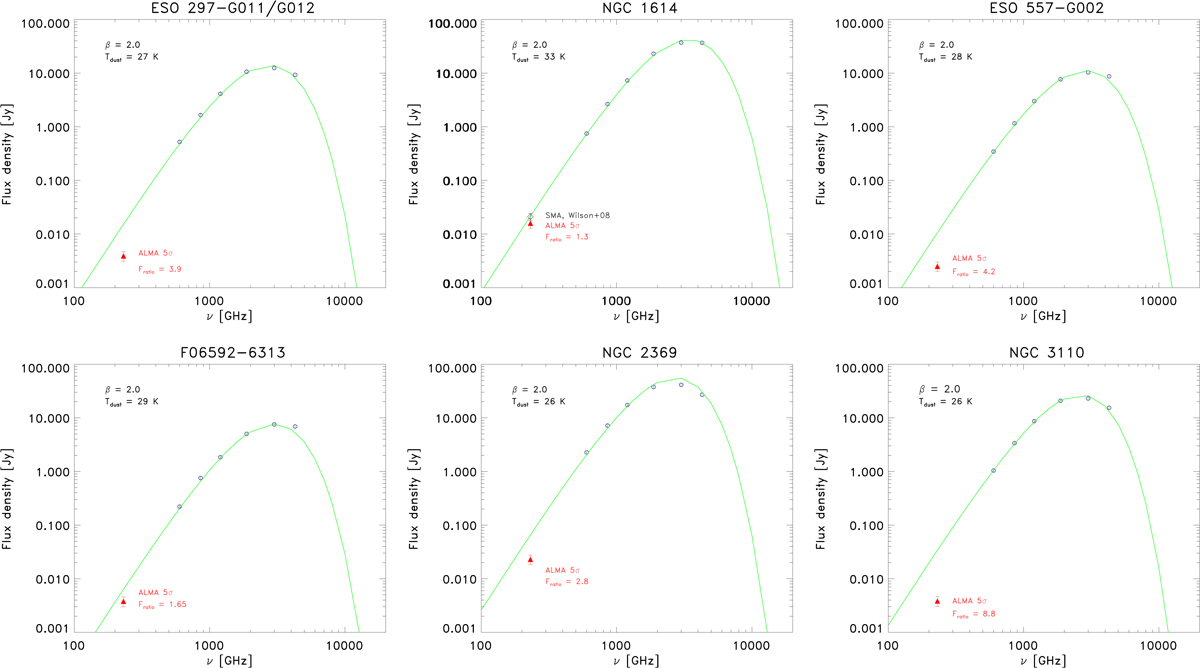
Fig. D.1.
Download original image
Spectral line energy distributions using Herschel data, assuming β = 2.0 and deriving the Tdust. The ALMA continuum flux at 1.3 mm at 5σ is also shown for a direct comparison. The ratio between the flux at 1.3 mm expected by the model and the ALMA value is also highlighted in red (Fratio).
Current usage metrics show cumulative count of Article Views (full-text article views including HTML views, PDF and ePub downloads, according to the available data) and Abstracts Views on Vision4Press platform.
Data correspond to usage on the plateform after 2015. The current usage metrics is available 48-96 hours after online publication and is updated daily on week days.
Initial download of the metrics may take a while.