Fig. 2.
Download original image
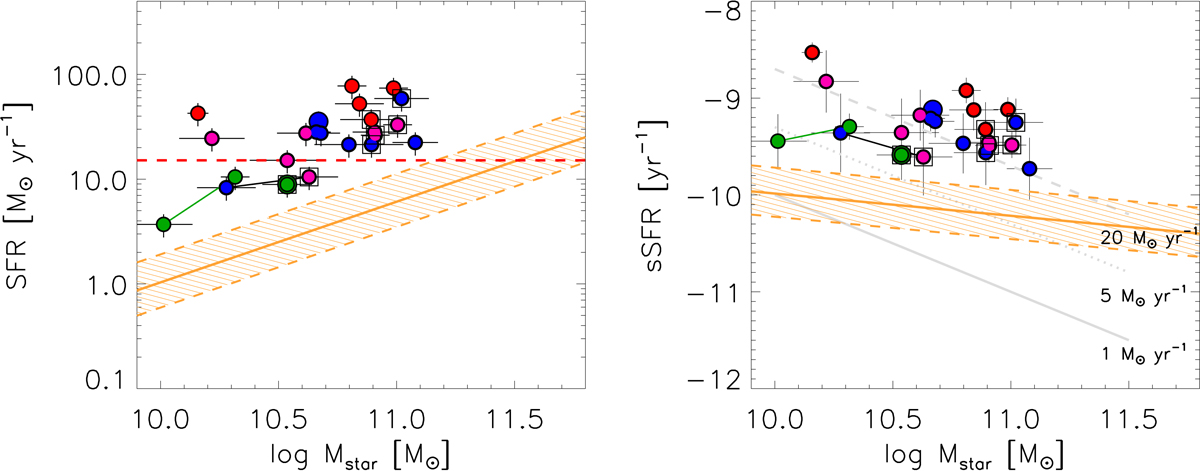
LIRG sample in the SFR - Mstar and sSFR - Mstar planes. Left: SFR as a function of the stellar mass Mstar. The solid and dashed (orange) lines indicate the location of the local MS relation and the 1σ scatter, respectively, obtained by Elbaz et al. (2007) using SDSS galaxies at z ∼ 0 and converted to Kroupa IMF, in agreement with that derived by Whitaker et al. (2012). Our LIRGs are shown according to the color code defined in Fig. 1: isolated disks (RD), (PD), interacting, and merging systems are shown in blue, magenta, green, and red, respectively. The solid lines between the points (green and black) link galaxies that belong to the same system. Galaxies containing an AGN are identified with an empty black square. The horizontal red dashed line represents the threshold SFR to reach the LIRG IR luminosity (log LIR/L⊙ ≥ 11). Right: specific SFR as a function of the stellar mass Mstar. The three (solid, dotted, and dashed) gray lines identify the different SFR regimes (i.e., 1, 5, and 20 M⊙ yr−1, respectively). The MS relation is also shown (in orange).
Current usage metrics show cumulative count of Article Views (full-text article views including HTML views, PDF and ePub downloads, according to the available data) and Abstracts Views on Vision4Press platform.
Data correspond to usage on the plateform after 2015. The current usage metrics is available 48-96 hours after online publication and is updated daily on week days.
Initial download of the metrics may take a while.