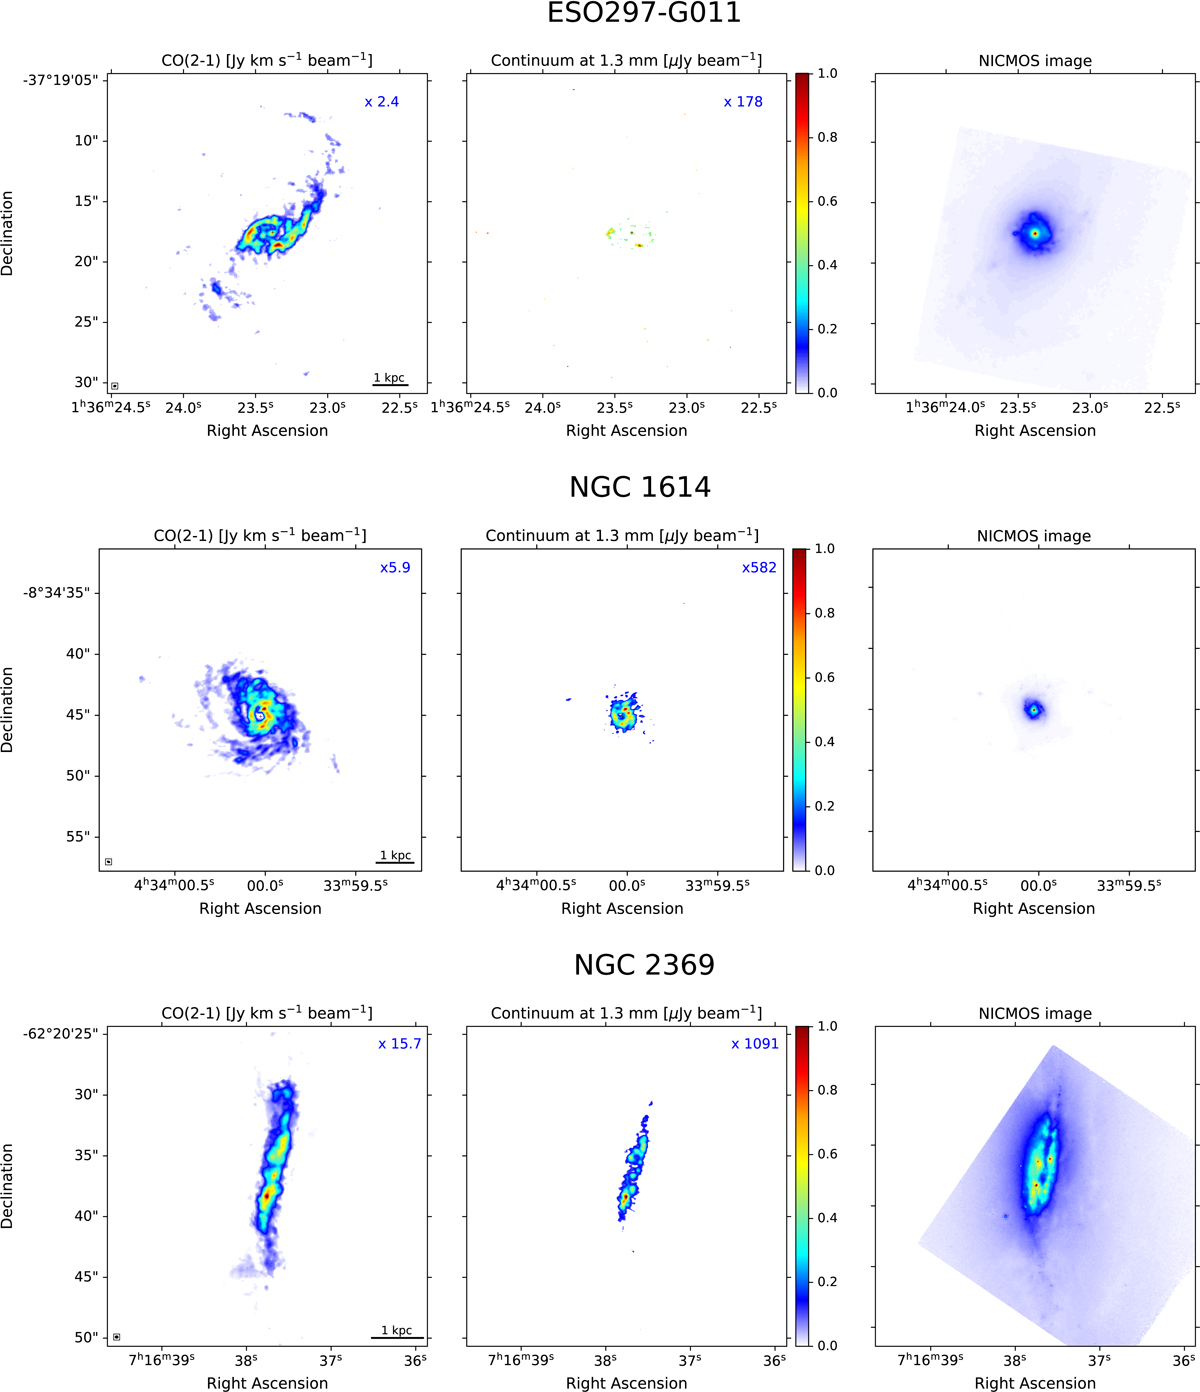
Fig. B.1.
Download original image
From left to right: CO(2–1) and 1.3 mm continuum maps obtained with ALMA, complemented by HST/NICMOS image when available. The CO(2–1) and 1.3 mm emission is > 5σ. The color bar is normalized to the maximum value of each ALMA map: in order to derive the real maximum value, a factor scale, shown in the top-right of each panel, has to be applied. The cross symbol in the three panels represents the stellar peak emission identified using the HST/NICMOS image. The beam size and the physical scale in kpc are also shown in the left panel. In all panels, north is up and east to the left.
Current usage metrics show cumulative count of Article Views (full-text article views including HTML views, PDF and ePub downloads, according to the available data) and Abstracts Views on Vision4Press platform.
Data correspond to usage on the plateform after 2015. The current usage metrics is available 48-96 hours after online publication and is updated daily on week days.
Initial download of the metrics may take a while.