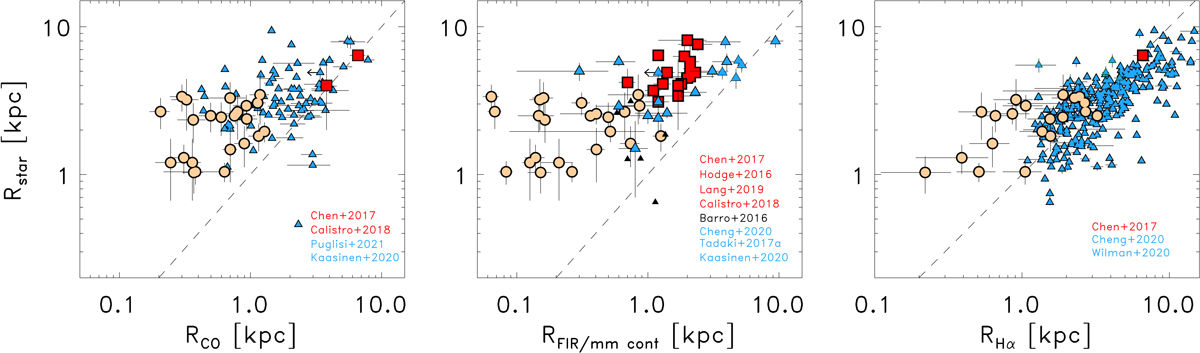
Fig. 15.
Download original image
Ratios of different tracers in high-z (z = 2 − 2.5) galaxy samples relative to the low-z LIRG sample (Table 6). Left: stellar versus molecular size. Middle: stellar versus mm/submm (dust-) continuum size. Right: stellar versus ionized gas size. Our sample is shown using light orange circles, while the high-z galaxies are shown following the same symbol and color code shown in Fig. 14. In each panel, we report the references from which the high-z data are taken. Rmm cont derived for our LIRGs were derived from our 1.3 mm ALMA observations, which we considered as lower limits due to the limited sensitivity of our observations.
Current usage metrics show cumulative count of Article Views (full-text article views including HTML views, PDF and ePub downloads, according to the available data) and Abstracts Views on Vision4Press platform.
Data correspond to usage on the plateform after 2015. The current usage metrics is available 48-96 hours after online publication and is updated daily on week days.
Initial download of the metrics may take a while.