Fig. 14.
Download original image
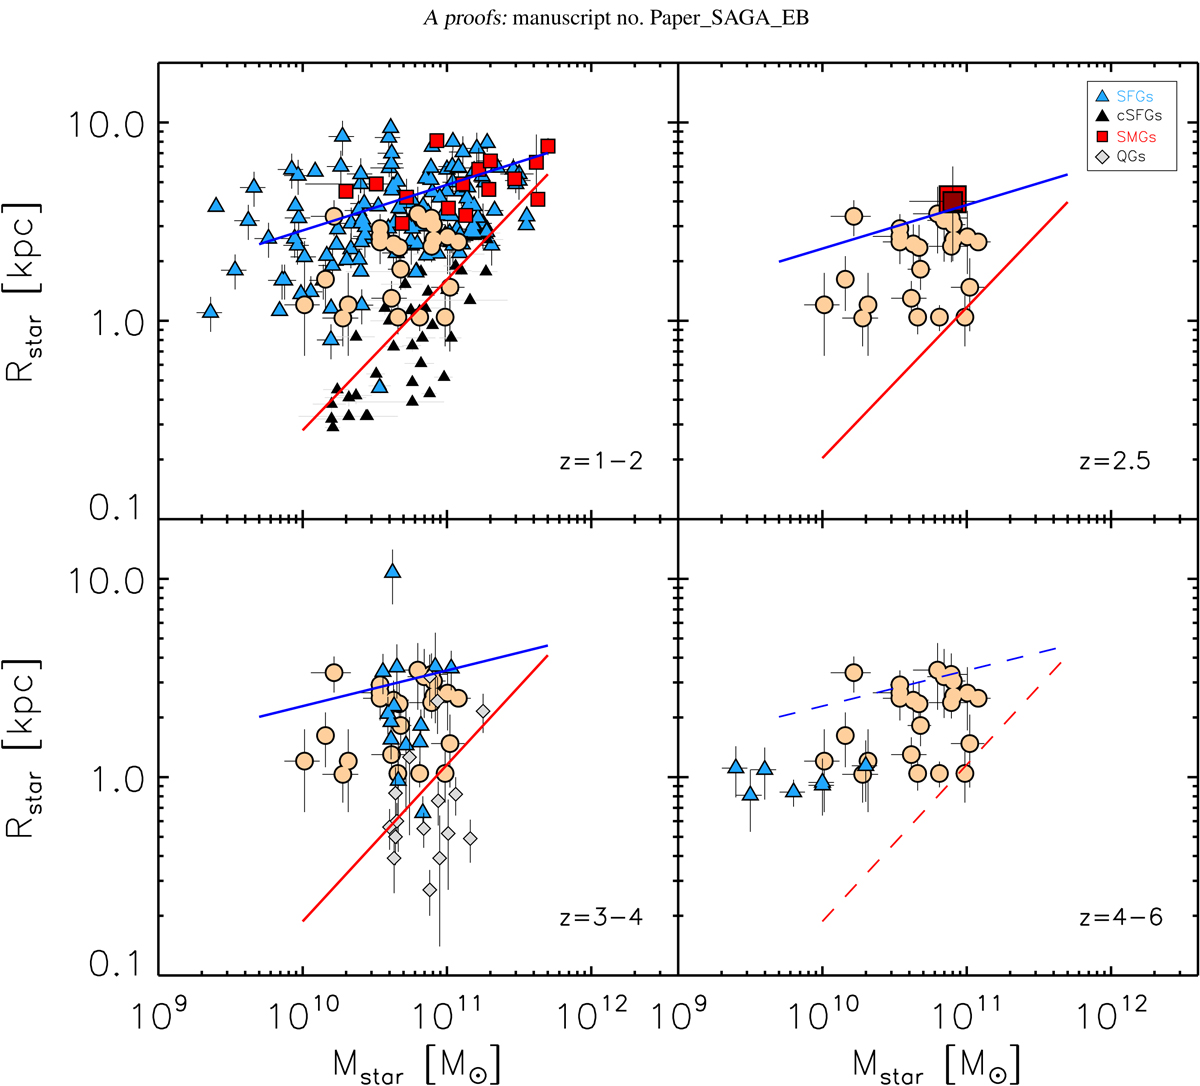
Mass–size distribution for our LIRGs and high-z galaxies (Table 6). LIRGs from this work are shown using light orange circles. High-z SFG and SMG data are taken from the following works: SMGs from Hodge et al. (2016), Chen et al. (2017), Calistro Rivera et al. (2018), and Lang et al. (2019) and SFGs from Barro et al. (2014), Straatman et al. (2015), Tadaki et al. (2017), Förster Schreiber et al. (2018), Cheng et al. (2020), Fujimoto et al. (2020), Kaasinen et al. (2020), Valentino et al. (2020), and Puglisi et al. (2021). The high-z data are shown following the color and symbol code shown in the legend. The blue and red lines in each redshift range represent the mass–size relations for late- and early-type galaxies, respectively, at z ∼ 1.75, 2.25, and 2.75 derived from the 3D-HST+CANDELS surveys (van der Wel et al. 2014). At z = 4 − 6, the mass–size relation for late- and early-type galaxies has not yet been derived, and so the dashed blue and red lines still show the behavior considered at z = 3 − 4.
Current usage metrics show cumulative count of Article Views (full-text article views including HTML views, PDF and ePub downloads, according to the available data) and Abstracts Views on Vision4Press platform.
Data correspond to usage on the plateform after 2015. The current usage metrics is available 48-96 hours after online publication and is updated daily on week days.
Initial download of the metrics may take a while.