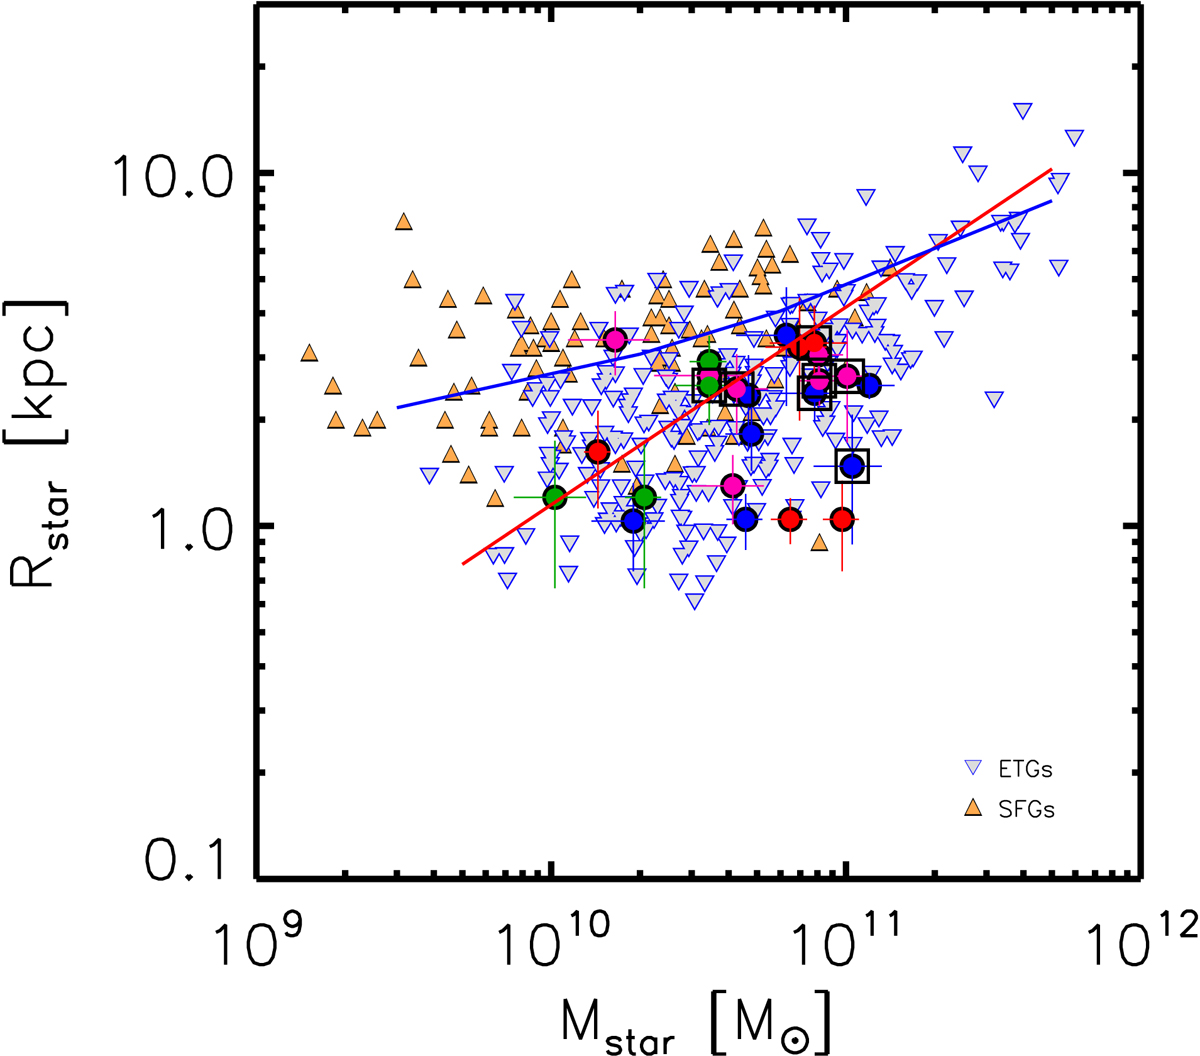
Fig. 13.
Download original image
Mass–size distribution for our LIRGs including ETGs and local spiral galaxies (i.e., MS SFGs; Leroy et al. 2021). ETGs are marked with (blue contour) down-pointing triangles and MS SFGs with up-pointing orange triangles. LIRGs are identified following the color code used in previous figures. The blue and red slopes represent the mass–size relations derived by Shen et al. (2003) (see also Fernández Lorenzo et al. 2013) for late- and early-type local galaxies, respectively.
Current usage metrics show cumulative count of Article Views (full-text article views including HTML views, PDF and ePub downloads, according to the available data) and Abstracts Views on Vision4Press platform.
Data correspond to usage on the plateform after 2015. The current usage metrics is available 48-96 hours after online publication and is updated daily on week days.
Initial download of the metrics may take a while.