Fig. 12.
Download original image
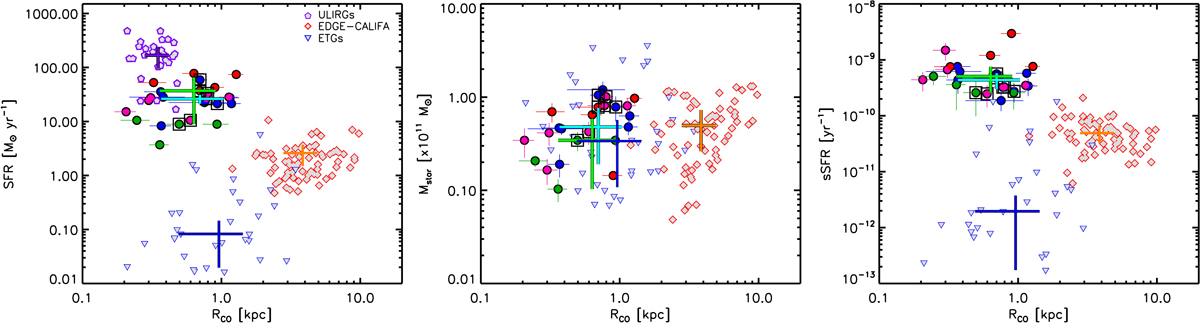
Distribution of LIRGs and other low-z galaxy samples in the SFR–RCO (left), Mstar–RCO (middle), and sSFR–RCO (right) planes. Our LIRGs are shown according to the color code presented in Fig. 1. Local spiral galaxy (gray, red-contoured diamonds) values are taken from the EDGE-CALIFA survey (Bolatto et al. 2017) while ETGs (blue contoured, down-pointing triangles) are taken from the ATLAS3D sample (Cappellari et al. 2013a). ULIRG (purple pentagons) values are derived from ALMA data (Pereira-Santaella et al. 2021). The median value of each sample is shown according to the following color code: purple for ULIRGs, light green for interacting and merger LIRGs, light blue for disky (i.e., RD and PD) LIRGs, orange for spiral galaxies, and dark blue for ETGs. In ULIRGs, the AGN contribution has been removed to estimate their SFRs.
Current usage metrics show cumulative count of Article Views (full-text article views including HTML views, PDF and ePub downloads, according to the available data) and Abstracts Views on Vision4Press platform.
Data correspond to usage on the plateform after 2015. The current usage metrics is available 48-96 hours after online publication and is updated daily on week days.
Initial download of the metrics may take a while.