Fig. 11.
Download original image
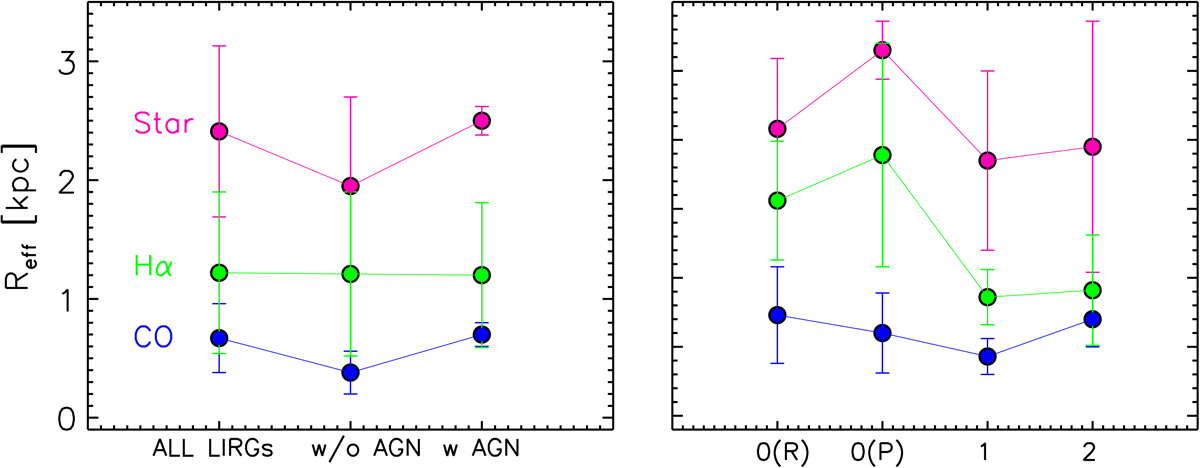
Median effective radii (and MAD) derived for the different tracers and subsamples. The stellar, ionized, and CO(2–1) Reff are shown in magenta, green, and blue, respectively. Left: median values for the whole sample are shown (i.e., ‘ALL LIRGs’), along with the median values derived for the LIRG subsample with (w AGN) and without (w/o AGN) an AGN. Right: median Reff for the four subsamples defined in Table 1 (0(R) 0(P), 1, 2) are shown.
Current usage metrics show cumulative count of Article Views (full-text article views including HTML views, PDF and ePub downloads, according to the available data) and Abstracts Views on Vision4Press platform.
Data correspond to usage on the plateform after 2015. The current usage metrics is available 48-96 hours after online publication and is updated daily on week days.
Initial download of the metrics may take a while.