Fig. 8.
Download original image
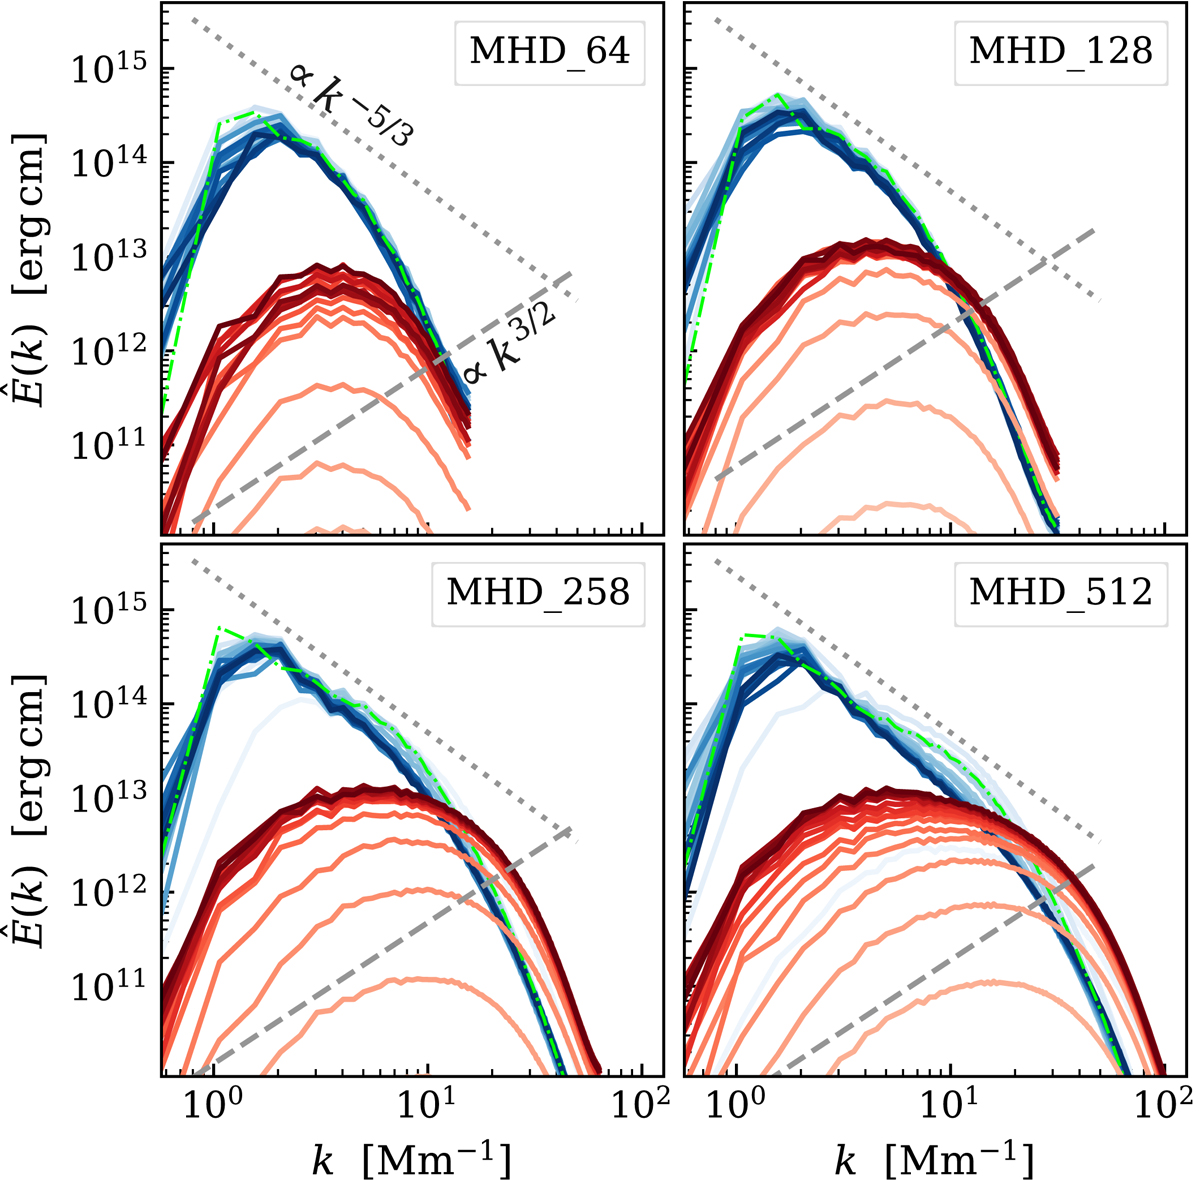
Time evolution of the power spectra of the turbulent kinetic energy ![]() (blue) and magnetic energy
(blue) and magnetic energy ![]() (red) for the four magneto-hydrodynamical (MHD) simulations. The time evolution is represented by the color grading: light colors correspond to early times, while the darkest shade corresponds to the last snapshot of the simulation. The time interval between each shade is 5000 s for MHD_64, 1000 s for MHD_128, 500 s for MHD_256, and 300 s for MHD_512. The average quasi-steady state kinetic energy power spectrum for the hydrodynamical simulation HD_512 is shown in green.
(red) for the four magneto-hydrodynamical (MHD) simulations. The time evolution is represented by the color grading: light colors correspond to early times, while the darkest shade corresponds to the last snapshot of the simulation. The time interval between each shade is 5000 s for MHD_64, 1000 s for MHD_128, 500 s for MHD_256, and 300 s for MHD_512. The average quasi-steady state kinetic energy power spectrum for the hydrodynamical simulation HD_512 is shown in green.
Current usage metrics show cumulative count of Article Views (full-text article views including HTML views, PDF and ePub downloads, according to the available data) and Abstracts Views on Vision4Press platform.
Data correspond to usage on the plateform after 2015. The current usage metrics is available 48-96 hours after online publication and is updated daily on week days.
Initial download of the metrics may take a while.