Open Access
Fig. 6.
Download original image
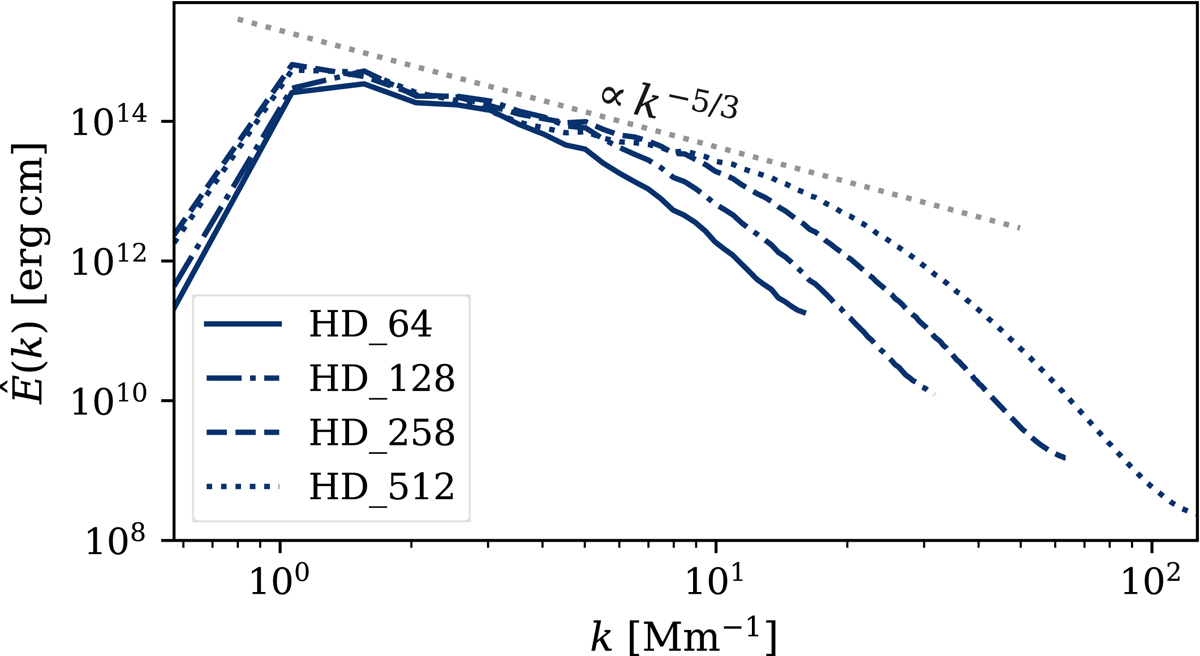
Comparison of the kinetic energy power spectra ![]() between the four HD simulations in the quasi-steady state regime. The profiles are obtained by averaging the power spectrum profiles over the last 10 snapshots of each simulation, that is between t = 1500 s and t = 2000 s.
between the four HD simulations in the quasi-steady state regime. The profiles are obtained by averaging the power spectrum profiles over the last 10 snapshots of each simulation, that is between t = 1500 s and t = 2000 s.
Current usage metrics show cumulative count of Article Views (full-text article views including HTML views, PDF and ePub downloads, according to the available data) and Abstracts Views on Vision4Press platform.
Data correspond to usage on the plateform after 2015. The current usage metrics is available 48-96 hours after online publication and is updated daily on week days.
Initial download of the metrics may take a while.