Open Access
Fig. 5.
Download original image
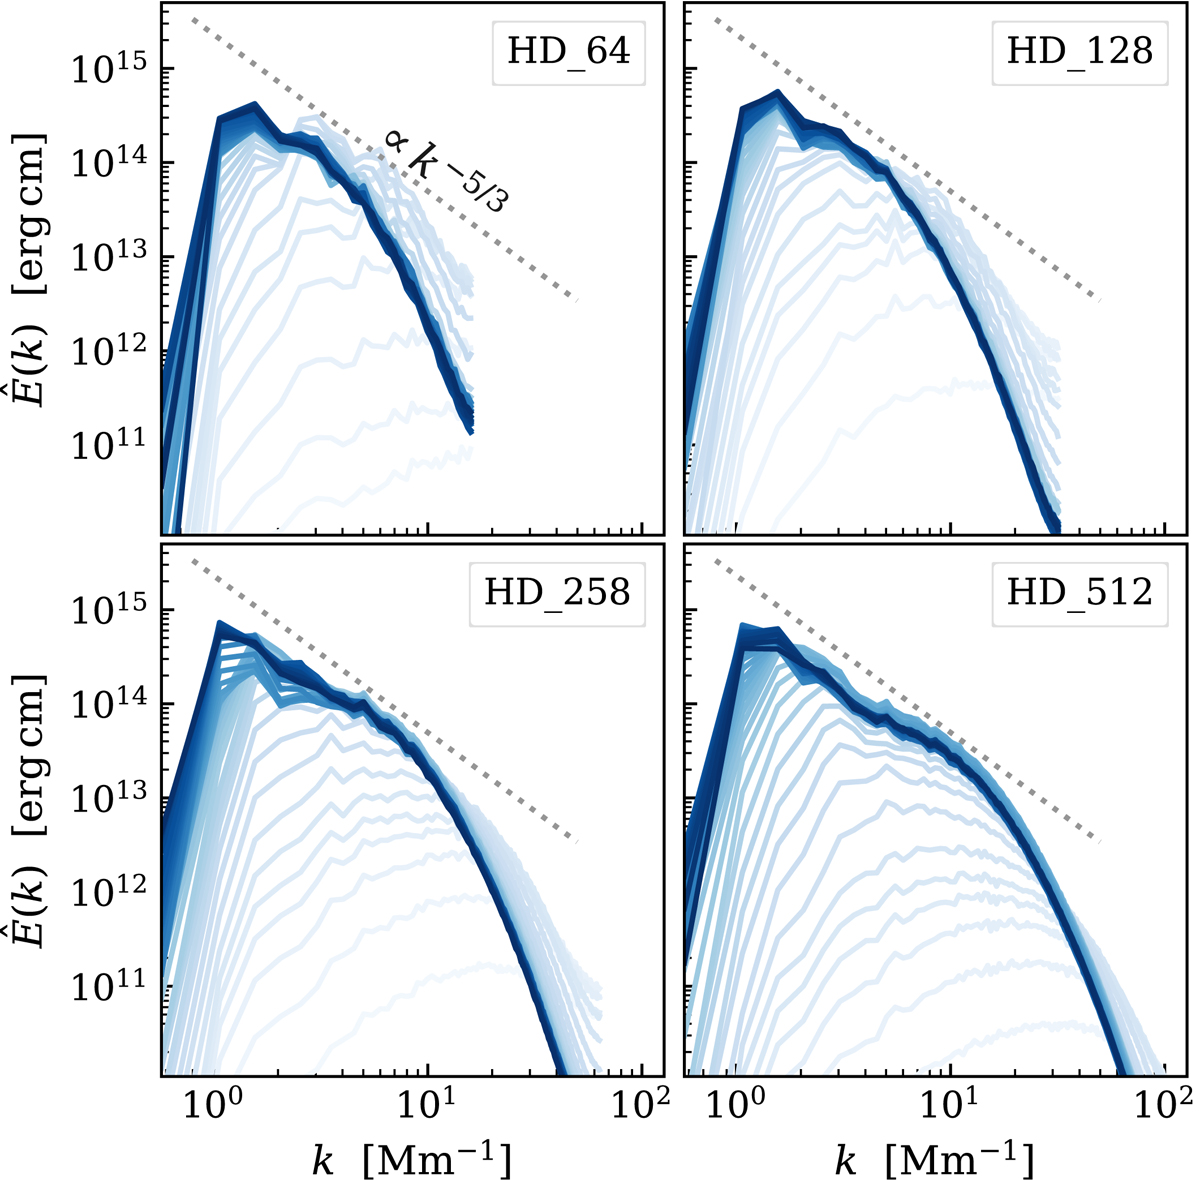
Time evolution of the turbulent kinetic energy power spectra ![]() for the four HD simulations. The time evolution is represented by the color grading: light blues correspond to early times, while the darkest shade corresponds to t = 2000 s. The interval between each color-shade is 50 s.
for the four HD simulations. The time evolution is represented by the color grading: light blues correspond to early times, while the darkest shade corresponds to t = 2000 s. The interval between each color-shade is 50 s.
Current usage metrics show cumulative count of Article Views (full-text article views including HTML views, PDF and ePub downloads, according to the available data) and Abstracts Views on Vision4Press platform.
Data correspond to usage on the plateform after 2015. The current usage metrics is available 48-96 hours after online publication and is updated daily on week days.
Initial download of the metrics may take a while.