Open Access
Fig. 18.
Download original image
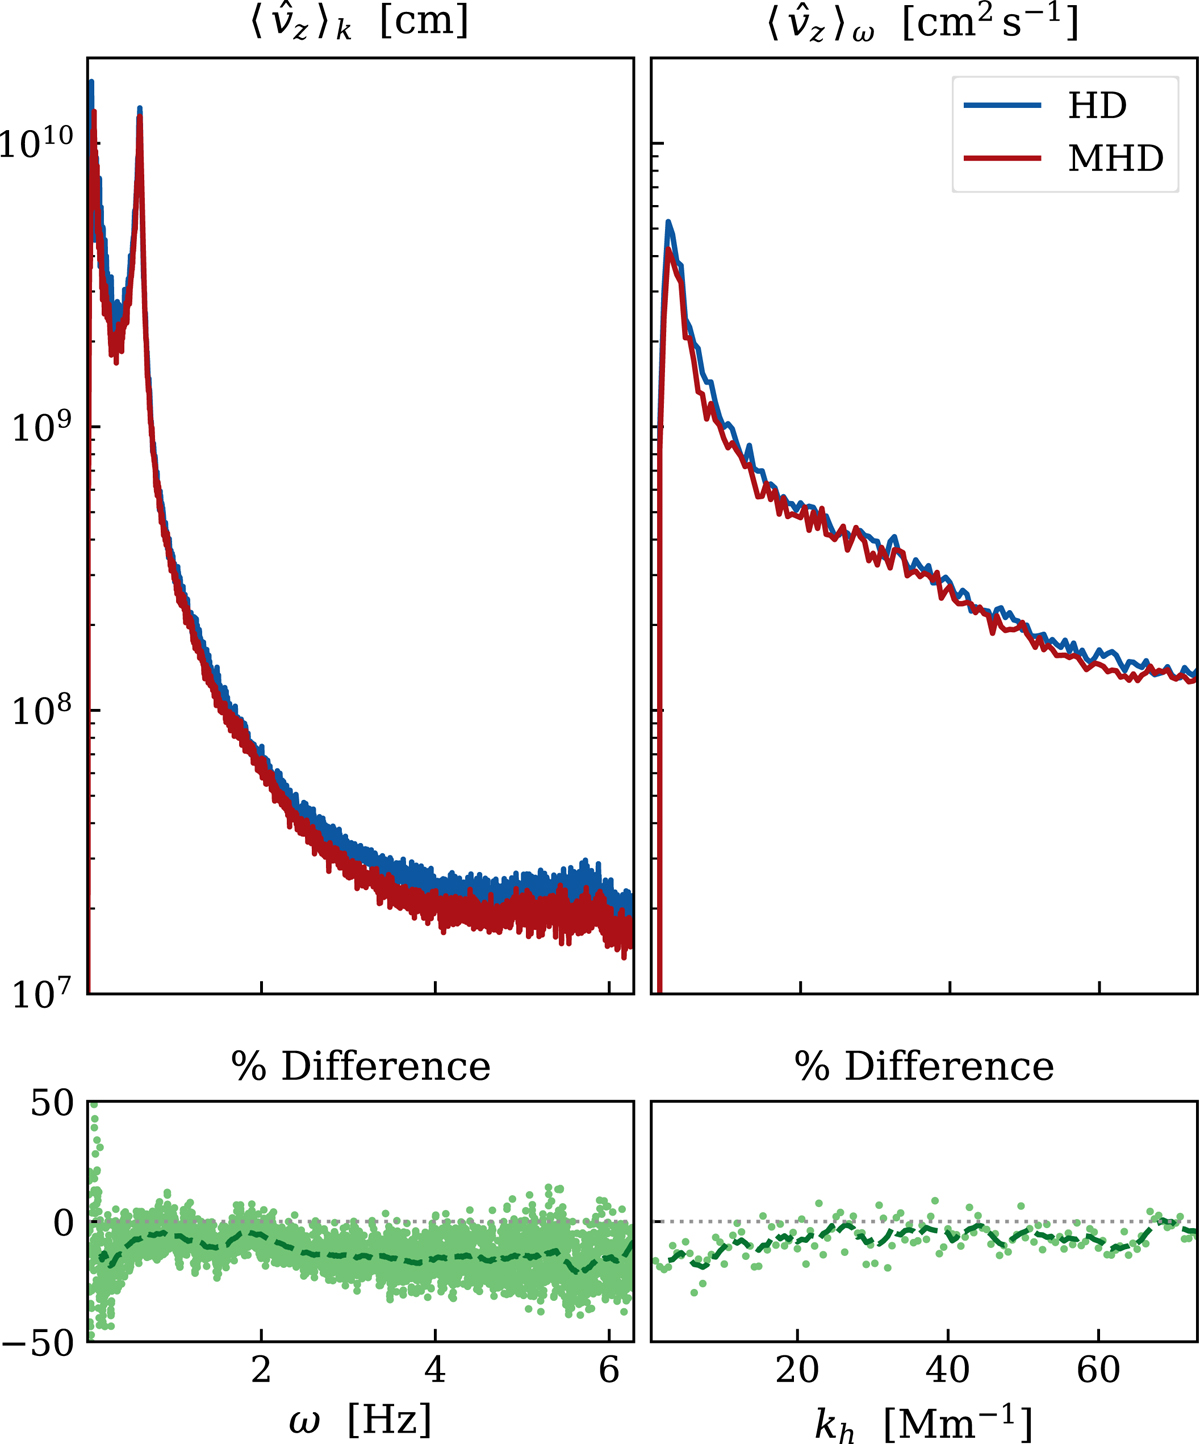
Comparison between the mean power as a function of frequency ω (left) and of horizontal wavenumber kh (right) for the HD_256 and MHD_256 simulations at z = 8.5 Mm. The bottom panels show the relative difference between the two signals in percentage. The green dashed line shows a smoothed interpolation of the data points.
Current usage metrics show cumulative count of Article Views (full-text article views including HTML views, PDF and ePub downloads, according to the available data) and Abstracts Views on Vision4Press platform.
Data correspond to usage on the plateform after 2015. The current usage metrics is available 48-96 hours after online publication and is updated daily on week days.
Initial download of the metrics may take a while.