Fig. 17.
Download original image
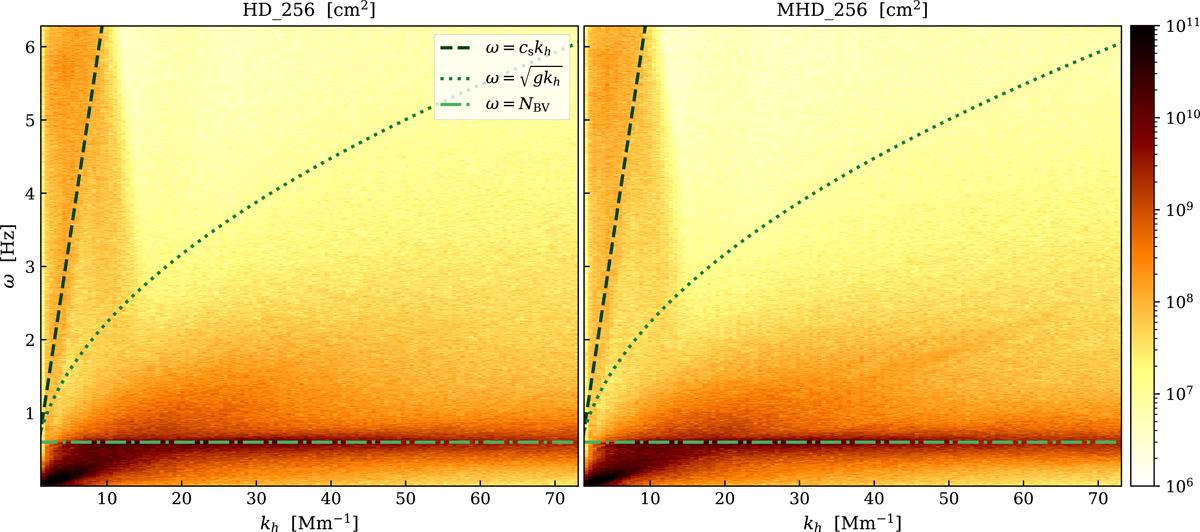
Wave diagnostic diagrams, also knows as kh − ω diagrams, for the HD_256 (left) and MHD_256 (right) simulations at z = 8.5 Mm. The sampling rate and grid cell size are Δts = 0.5 s and Δx = 42.0 km, respectively. The strength of the signal is color-coded. The dispersion relations for sound waves and surface modes are shown in dashed and dotted lines, respectively. The Brunt–Väisälä frequency is depicted by a dash-dotted line.
Current usage metrics show cumulative count of Article Views (full-text article views including HTML views, PDF and ePub downloads, according to the available data) and Abstracts Views on Vision4Press platform.
Data correspond to usage on the plateform after 2015. The current usage metrics is available 48-96 hours after online publication and is updated daily on week days.
Initial download of the metrics may take a while.