Fig. 15.
Download original image
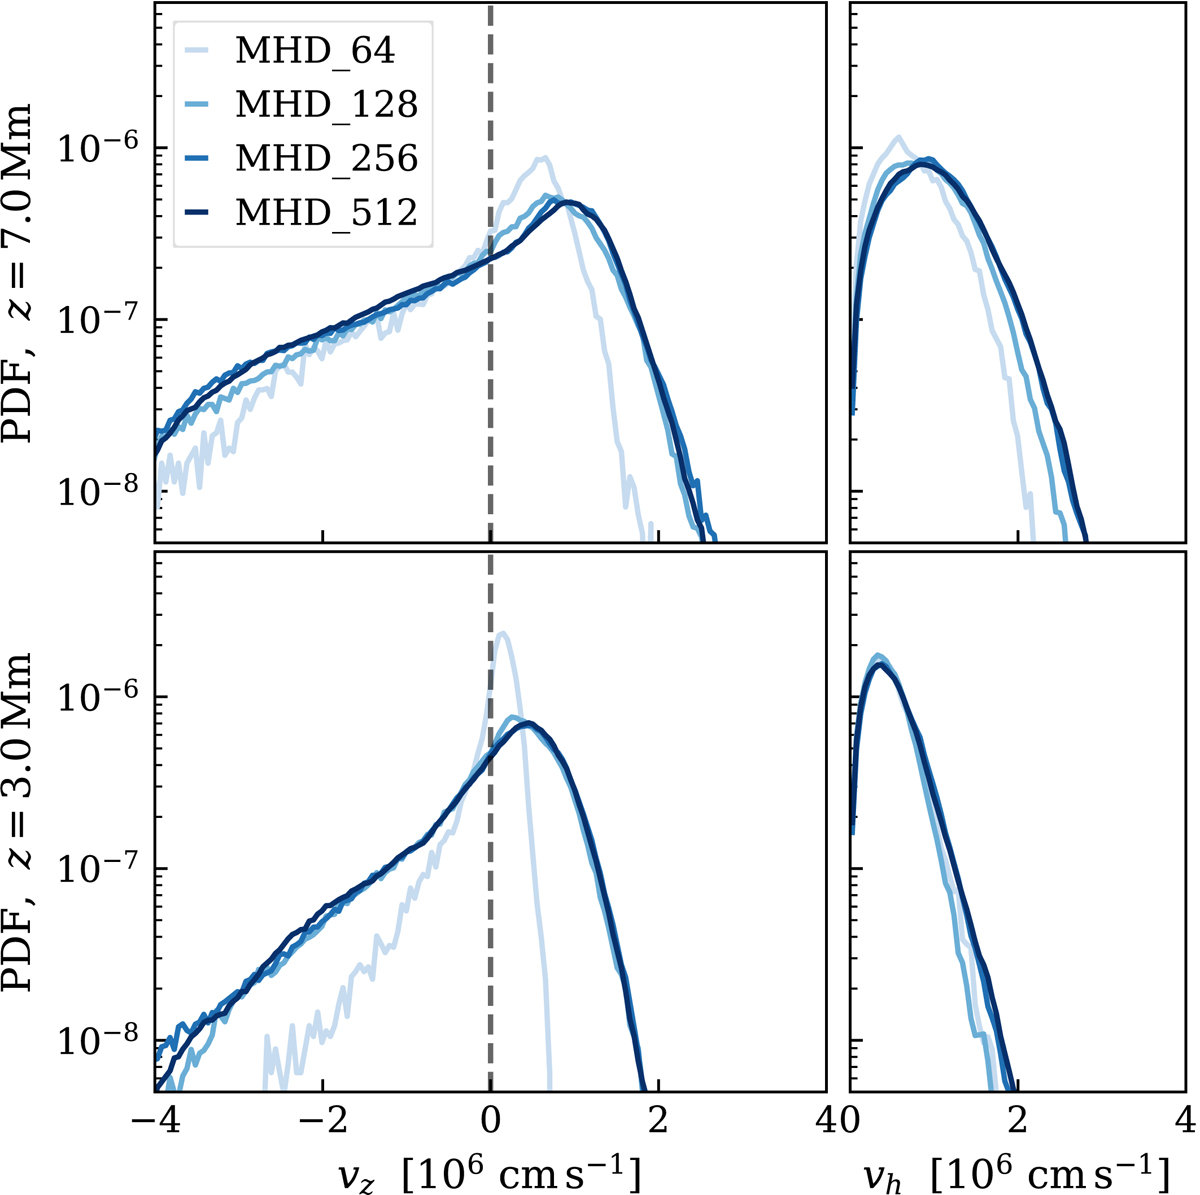
Probability density functions (PDF) of the vertical (left column) and horizontal (right column) components of the velocity field in the four MHD simulations after reaching the quasi-steady state. The PDFs are computed over a horizontal section at z = 7.0 Mm (top row) and at z = 3.0 Mm (bottom row), corresponding to top and bottom convection zone, respectively.
Current usage metrics show cumulative count of Article Views (full-text article views including HTML views, PDF and ePub downloads, according to the available data) and Abstracts Views on Vision4Press platform.
Data correspond to usage on the plateform after 2015. The current usage metrics is available 48-96 hours after online publication and is updated daily on week days.
Initial download of the metrics may take a while.